PHT Public Trust Board Papers March 2011.pdf - Plymouth Hospitals
PHT Public Trust Board Papers March 2011.pdf - Plymouth Hospitals
PHT Public Trust Board Papers March 2011.pdf - Plymouth Hospitals

Create successful ePaper yourself
Turn your PDF publications into a flip-book with our unique Google optimized e-Paper software.
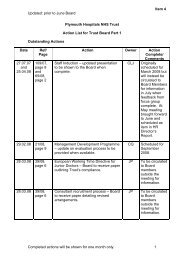
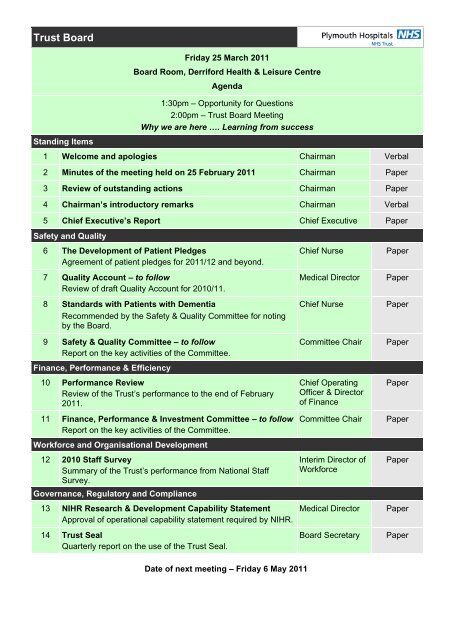
<strong>Trust</strong> <strong>Board</strong><br />
Standing Items<br />
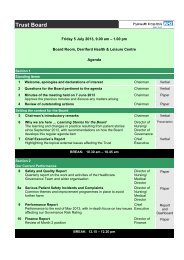
Friday 25 <strong>March</strong> 2011<br />
<strong>Board</strong> Room, Derriford Health & Leisure Centre<br />
Agenda<br />
1:30pm – Opportunity for Questions<br />
2:00pm – <strong>Trust</strong> <strong>Board</strong> Meeting<br />
Why we are here …. Learning from success<br />
1 Welcome and apologies Chairman Verbal<br />
2 Minutes of the meeting held on 25 February 2011 Chairman Paper<br />
3 Review of outstanding actions Chairman Paper<br />
4 Chairman’s introductory remarks Chairman Verbal<br />
5 Chief Executive’s Report Chief Executive Paper<br />
Safety and Quality<br />
6 The Development of Patient Pledges<br />
Agreement of patient pledges for 2011/12 and beyond.<br />
7 Quality Account – to follow<br />
Review of draft Quality Account for 2010/11.<br />
8 Standards with Patients with Dementia<br />
Recommended by the Safety & Quality Committee for noting<br />
by the <strong>Board</strong>.<br />
9 Safety & Quality Committee – to follow<br />
Report on the key activities of the Committee.<br />
Finance, Performance & Efficiency<br />
10 Performance Review<br />
Review of the <strong>Trust</strong>’s performance to the end of February<br />
2011.<br />
11 Finance, Performance & Investment Committee – to follow<br />
Report on the key activities of the Committee.<br />
Workforce and Organisational Development<br />
12 2010 Staff Survey<br />
Summary of the <strong>Trust</strong>’s performance from National Staff<br />
Survey.<br />
Governance, Regulatory and Compliance<br />
13 NIHR Research & Development Capability Statement<br />
Approval of operational capability statement required by NIHR.<br />
14 <strong>Trust</strong> Seal<br />
Quarterly report on the use of the <strong>Trust</strong> Seal.<br />
Chief Nurse<br />
Medical Director<br />
Chief Nurse<br />
Committee Chair<br />
Chief Operating<br />
Officer & Director<br />
of Finance<br />
Committee Chair<br />
Interim Director of<br />
Workforce<br />
Medical Director<br />
<strong>Board</strong> Secretary<br />
Paper<br />
Paper<br />
Paper<br />
Paper<br />
Paper<br />
Paper<br />
Paper<br />
Paper<br />
Paper<br />
Date of next meeting – Friday 6 May 2011
Item 2<br />
Present:<br />
Apologies:<br />
<strong>Plymouth</strong> <strong>Hospitals</strong> NHS <strong>Trust</strong><br />
Minutes of the <strong>Trust</strong> <strong>Board</strong> meeting Part 1<br />
held on Friday 25 February 2011 in the<br />
<strong>Board</strong> Room, Derriford Health & Leisure Centre<br />
2.00 pm Questions<br />
Steven Jermy, Chairman<br />
Peter Burroughs, Non-Executive Director<br />
Alex Mayor, Medical Director<br />
Helen O’Shea, Chief Operating Officer<br />
Lee Paschalides, Non-Executive Director<br />
David Pond, Non-Executive Director<br />
Paul Roberts, Chief Executive<br />
Margaret Schwarz, Non-Executive Director<br />
D<br />
Sarah Watson-Fisher, Chief Nurse<br />
Ian Douglas, Non-Executive Director<br />
Joe Teape, Director of Finance<br />
R<br />
Sarah Brampton, Director of Financial Services & Performance<br />
In Attendance: Paul Beal, Interim Director of Workforce<br />
‘Governors’ In<br />
Attendance<br />
Lee Budge, Auditor<br />
Gill Hunt, FT <strong>Board</strong> Secretary<br />
Barry Lucas, LINk and Patient Representative, <strong>Public</strong> ‘Governor’,<br />
<strong>Plymouth</strong> Constituency<br />
A<br />
Amanda Nash, Head of Communications<br />
Brian Bird, <strong>Public</strong> ‘Governor’, Devon Constituency<br />
Vera Mitchell, <strong>Public</strong> ‘Governor’, <strong>Plymouth</strong> Constituency<br />
Ivor Vaughan, <strong>Public</strong> ‘Governor’, Cornwall Constituency<br />
F<br />
The Chairman welcomed ‘governors’, members of the public and press, and<br />
apologised for the late start to the public meeting. The Chairman invited questions.<br />
These primarily concerned recent media attention on six ‘never events’ and the<br />
issue, by the Care Quality Commission (CQC), of a warning notice on 22 February<br />
2011.<br />
T<br />
On behalf of <strong>Plymouth</strong> LINk, Mr Lucas asked why the <strong>Trust</strong> had not been proactive<br />
in alerting the CQC as each ‘never event’ had occurred. The Chief Executive<br />
updated Mr Lucas on his recent meeting with the CQC at which the warning notice<br />
had been issued. He assured Mr Lucas that the <strong>Board</strong> regularly received reports<br />
of all Serious Clinical Incidents (SUIs) and ‘never events’ had been discussed at the<br />
<strong>Board</strong>, both in private and in public. The Chief Executive offered to speak directly<br />
with LINk, if LINk felt this was appropriate. The Medical Director stated the <strong>Board</strong>’s<br />
desire to be as open and honest as possible, and although patient confidentiality<br />
did not permit discussion of specific cases, he stressed that no patient had come to<br />
1
Item 2<br />
any long term harm. The Chairman affirmed that it was the <strong>Board</strong>’s absolute<br />
intention to be open and to promote a just culture where staff were held to account.<br />
Patient safety was the <strong>Board</strong>’s highest priority.<br />
Mr Lucas asked if the <strong>Trust</strong> intended to dismiss any staff in respect of the ‘never<br />
events’. The Chief Executive stated that there were policies and procedures in<br />
place for staff to follow. The <strong>Trust</strong> would be fair in its investigations but staff would<br />
be held to account. The Chairman stressed the importance of understanding the<br />
cause of ‘never events’; it may be a systematic failure but, if blame were<br />
attributable then, as the Chief Executive had stated, individuals would be held to<br />
account.<br />
Mr Lucas asked whether the ‘never events’ were the result of a systems failure.<br />
The Medical Director stated that a detailed investigation had been completed and<br />
where systems issues had<br />
D<br />
been identified, actions had been put into place to<br />
address them. Patient confidentiality prevented him from going into further detail.<br />
Mr Lucas asked whether the public would be advised when any disciplinary process<br />
had been finalised. The Interim Director of Workforce stated that this would be a<br />
matter for the <strong>Trust</strong>.<br />
R<br />
‘Governor’ Brian Bird stated that public confidence in the hospital had been<br />
seriously damaged by the ‘never events’ and that risk management appeared to<br />
have failed in these cases. Patient safety had been denied and he was concerned<br />
that the <strong>Trust</strong> had not been proactive in contacting the CQC. Mr Bird was<br />
concerned by the number of serious clinical incidents reported at the last meeting<br />
and urged the <strong>Trust</strong> to take<br />
A<br />
disciplinary action, where necessary. The Chief<br />
Executive stated that the <strong>Board</strong> had agreed at their meeting in January to contact<br />
the CQC and the Chairman assured Mr Bird that should negligence be identified,<br />
appropriate action would be taken. The Chief Executive stated that the CQC<br />
expected the <strong>Trust</strong> to make rapid improvements and he was confident that these<br />
would be achieved. Staff had worked hard to ensure incident reporting increased<br />
because this was absolutely crucial<br />
F<br />
for public safety.<br />
‘Governor’ Ivor Vaughan asked why the standard WHO checklist had not been in<br />
use. The Medical Director advised that <strong>Trust</strong> policies and procedures clearly stated<br />
that it should be. Audit had ascertained some variability to the standard checklist;<br />
this had been confirmed by the CQC and variability would be eliminated. The<br />
<strong>Board</strong> expected 100% compliance.<br />
T<br />
‘Governor’ Vera Mitchell expressed her disappointment at the issue of the CQC’s<br />
warning notice but was confident in the <strong>Trust</strong>’s intention, and in its ability, to put<br />
matters right. Mrs Mitchell was concerned by South West Water’s intention to<br />
increase water bills by 8.1% and asked what effect this would have on the <strong>Trust</strong>.<br />
The Director of Financial Services stated that utilities inflation costs were included<br />
in the Annual Business Plan for 2011/2012 and she would be pleased to pick this<br />
up further with Mrs Mitchell outside the meeting.<br />
A member of the public asked why the <strong>Trust</strong> appeared to discriminate against<br />
patients with medical phobias. She had made a formal complaint about her own<br />
2
Item 2<br />
recent experiences, to which she did not expect a specific response at this forum,<br />
but sought a generic response from the <strong>Board</strong>. Her experiences had inspired her to<br />
become an advocate for patients with medical phobias. The Chief Executive<br />
welcomed her advocacy and agreed that her point was fair. He could not respond<br />
immediately but would be pleased to do so outside the meeting.<br />
‘Governor’ Ivor Vaughan stated that there was a lack of patient privacy and dignity<br />
caused by ambulance offloading arrangements adjacent to the Orthopaedic Clinic.<br />
The Medical Director stated that the current arrangements may result from the<br />
requirement to maintain a clear emergency pathway for patients arriving by<br />
helicopter, and for emergency resuscitation access, but he would consider what<br />
improvements could be made.<br />
There were no further questions.<br />
D<br />
R<br />
A<br />
F<br />
T<br />
3
Item 2<br />
<strong>Plymouth</strong> <strong>Hospitals</strong> NHS <strong>Trust</strong><br />
Minutes of the <strong>Trust</strong> <strong>Board</strong> meeting Part 1<br />
held at 2.30 pm on Friday 25 February 2011 in the<br />
<strong>Board</strong> Room, Derriford Health & Leisure Centre<br />
Present:<br />
Apologies:<br />
Steven Jermy, Chairman<br />
Peter Burroughs, Non-Executive Director<br />
Alex Mayor, Medical Director<br />
Helen O’Shea, Chief Operating Officer<br />
Lee Paschalides, Non-Executive Director<br />
David Pond, Non-Executive Director<br />
Paul Roberts, Chief Executive<br />
Margaret Schwarz, Non-Executive Director<br />
Sarah Watson-Fisher, Chief Nurse<br />
D<br />
Ian Douglas, Non-Executive Director<br />
Joe Teape, Director of Finance<br />
In Attendance: Paul Beal, Interim Director of Workforce<br />
Sarah Brampton, Director of Financial Services & Performance<br />
Lee Budge, Auditor<br />
‘Governors’ In<br />
Attendance<br />
R<br />
Gill Hunt, FT <strong>Board</strong> Secretary<br />
Barry Lucas, LINk and Patient Representative, <strong>Public</strong> ‘Governor’,<br />
<strong>Plymouth</strong> Constituency<br />
Amanda Nash, Head of Communications<br />
A<br />
Vera Mitchell, <strong>Public</strong> ‘Governor’, <strong>Plymouth</strong> Constituency<br />
Brian Bird, <strong>Public</strong> ‘Governor’, Devon Constituency<br />
Ivor Vaughan, <strong>Public</strong> ‘Governor’, Cornwall Constituency<br />
F<br />
18/11 Welcome and apologies<br />
There were no apologies for absence.<br />
Action<br />
19/11 Minutes of the meeting held on 28 January 2011<br />
T<br />
The minutes were agreed as a true and accurate record of the<br />
meeting.<br />
20/11 Matters Arising<br />
There were no matters arising.<br />
21/11 Review of Outstanding Actions<br />
There were no outstanding actions and the <strong>Board</strong> noted the<br />
Action List.<br />
4
Item 2<br />
22/11 Chairman’s Introductory Remarks<br />
The Chairman stated that the <strong>Board</strong>’s discussions during the<br />
morning had focused on issues of patient safety, business<br />
management and leadership.<br />
23/11 Chief Executive’s Overview<br />
The Chief Executive briefed the <strong>Board</strong> on issues of topical<br />
interest.<br />
Care Quality Commission (CQC)<br />
The Chief Executive updated the <strong>Board</strong> on the outcome of the<br />
meeting with the CQC<br />
D<br />
on 22 February, on the implications of the<br />
CQC’s regulatory response resulting from the <strong>Trust</strong>’s inadequate<br />
compliance with the WHO’s surgical safety checklist and the<br />
subsequent service of a warning notice requiring compliance<br />
within 28 days. The CQC would make public a full report on<br />
their visit and the <strong>Trust</strong> was required to produce a robust and<br />
comprehensive action plan to address their concerns.<br />
R<br />
The main points of the <strong>Board</strong>’s discussions were:<br />
• Assurance to the public that patient safety was the top<br />
priority for the <strong>Board</strong>.<br />
A<br />
• Ensuring that every member of staff understood their own<br />
responsibilities for patient safety and that in every<br />
operating theatre there was a single accountable person.<br />
• An observational audit across all theatres and a single,<br />
mandatory,<br />
F<br />
WHO checklist had been implemented.<br />
Identification of non-compliance may involve disciplinary<br />
action. Executive <strong>Board</strong> members were working closely<br />
with nursing and medical leads to support them in the<br />
delivery of this.<br />
T<br />
• The importance of positive and productive discussions<br />
with the CQC; the fostering of a good relationship<br />
between the <strong>Trust</strong> and its Regulator was crucial in<br />
assisting regulators to do their work.<br />
Health Service Ombudsman’s Report on Care of the Elderly<br />
This national report was disturbing and highlighted the<br />
responsibilities involved in the care of this large and vulnerable<br />
group. The Chief Executive had visited ward staff on the day of<br />
the report’s publication and there was a shared sense of<br />
personal responsibility – which extended through the <strong>Trust</strong> and<br />
included the <strong>Board</strong> – that all staff could learn from the case<br />
5
Item 2<br />
studies described in the report. The CQC had stated their<br />
intention to visit 100 hospitals in England and Wales following<br />
the report’s publication and the <strong>Trust</strong> should expect to receive a<br />
visit. On behalf of older people, the Chief Executive welcomed<br />
this.<br />
There was NED challenge on:<br />
• Assurance on preparedness for a CQC visit. 1 The Chief<br />
Nurse stated that staff had been fully briefed on<br />
communication standards expected for CQC visits. The<br />
Associate Director of Nursing & Midwifery had revisited<br />
issues of nutrition, communication, and privacy and<br />
dignity. Junior medical staff had been briefed at a recent<br />
clinical leadership group meeting.<br />
D<br />
• Did the <strong>Trust</strong> do enough to support feeding?<br />
Nurse stated that wards practised protected mealtimes.<br />
The recent PEAT inspection team had observed a lunch<br />
serving, although compliance on that day had been<br />
variable. The<br />
R<br />
Healthcare of the Elderly clinical pathway<br />
was about to be rolled out by the Associate Director of<br />
Nursing & Midwifery; this would facilitate improved care<br />
for patients with multiple conditions.<br />
2<br />
The Chief<br />
24/11<br />
The Chairman thanked the Chief Executive for his update,<br />
which was noted by the <strong>Board</strong>.<br />
A<br />
Quality Account 2010/2011 Priorities<br />
The Medical Director advised that preparations for the<br />
publication of the <strong>Trust</strong>’s Quality Account were on target to meet<br />
the 30 June deadline. Healthcare governance focus had shifted<br />
from process to outcomes and it was important for patients that<br />
F<br />
the <strong>Trust</strong> could measure and demonstrate good outcomes from<br />
past areas of focus. This would be the case for the Quality<br />
Account priorities for 2010/2011 and the <strong>Board</strong> were now asked<br />
to agree the priorities for achievement in 2011/2012 for inclusion<br />
in this year’s Quality Account. In accordance with Department of<br />
Health recommendations, the paper suggested five priorities for<br />
the <strong>Board</strong> to consider.<br />
T<br />
The key point of the <strong>Board</strong>’s discussions was:<br />
• Agreement that the five priorities must be measurable.<br />
This was particularly pertinent to the priority to improve<br />
overall patient satisfaction, for which changes in<br />
1 Margaret Schwarz<br />
2 Margaret Schwarz<br />
6
Item 2<br />
complaints management and reporting, and the collection<br />
of real time data on the patient experience at ward level,<br />
would be important factors.<br />
There was NED challenge on:<br />
• Effective communication with front line staff, particularly<br />
with regard to attitudes and behaviours. 3 The Chief Nurse<br />
stated that the answer lay in working with staff in a more<br />
formal setting on the importance of effective patient<br />
engagement. Simplicity was also important; simple<br />
measures, such as ward satisfaction levels, could have a<br />
big impact.<br />
The <strong>Board</strong> agreed<br />
D<br />
with the priorities recommended in the<br />
report and would expect to review the draft Quality<br />
Account, including measurable outcomes for last year’s<br />
priorities, at the <strong>March</strong> <strong>Board</strong>.<br />
MD<br />
25/11 Performance Report<br />
R<br />
The Director of Financial Services & Performance briefed the<br />
<strong>Board</strong> on the current financial position. The <strong>Trust</strong> was reporting<br />
a deficit of £3.8m, £4.1m adverse to budget but in line with the<br />
recovery plan agreed with NHS South West. Assuming the<br />
recovery plan remained<br />
A<br />
on track, the <strong>Trust</strong> continued to forecast<br />
the delivery of a break even position at the financial year end.<br />
The Chief Operating Officer reported good performance on<br />
infection control and Hospital Standardised Mortality Rates. The<br />
A&E 4 hour standard<br />
F<br />
improved in January, but was still under<br />
performing, with community performance at 94.64%, just below<br />
the 95% national target. Year to date performance remained<br />
above the national target. Referral to treatment targets were on<br />
trajectory to hit by <strong>March</strong> and the Chief Operating Officer drew<br />
the <strong>Board</strong>’s attention to new measuring standards from April<br />
2011. Reperfusion<br />
T<br />
waiting times were now measured by<br />
calendar year and clarification was required on whether this<br />
standard referred to all patients or only to those eligible for<br />
reperfusion. The drop in performance in Endoscopy should see<br />
improvement in February.<br />
Finance<br />
Performance<br />
Cancelled operations represented 1.9% of elective admissions,<br />
still below trajectory. The <strong>Trust</strong> had struggled with beds due to<br />
delayed discharges in January and there had been an increase<br />
in elective activity.<br />
3 Lee Paschalides<br />
7
Item 2<br />
Performance against Monitor’s scorecard was amber/red but,<br />
with adjustment for the now validated performance against<br />
cancer standards, this had improved to amber/green.<br />
Workforce<br />
The Interim Director of Workforce reported that sickness<br />
absence was disappointing but improvement was expected<br />
following a review of the Sickness Absence policy and focused<br />
support from Occupational Health and HR Business Partners.<br />
The non-medical staff appraisal rate was 75.61% and it was<br />
probable that organisational change had affected appraisal takeup.<br />
Additional interventional work was required to further simplify<br />
the appraisal process and related paperwork.<br />
D<br />
The <strong>Board</strong> noted the Performance Report.<br />
The Chief Nurse’s paper briefed the <strong>Board</strong> on the requirements<br />
of the <strong>Public</strong> Sector<br />
R<br />
Equality Duty, effective 1 April 2011. As<br />
well as specific duties relating to the availability of equality data<br />
and the setting, by April 2012, of equality objectives, the paper<br />
reminded the <strong>Board</strong> of the three general equality duties:<br />
26/11 Equality and Diversity: the <strong>Public</strong> Sector Duty<br />
27/11<br />
• Eliminate unlawful discrimination, harassment and<br />
victimisation.<br />
• Advance equality of opportunity between different groups.<br />
A<br />
• Foster good relations between different groups.<br />
The strategic issue for the <strong>Trust</strong> was to mainstream the equality<br />
and diversity agenda. The Workforce Directorate would lead on<br />
this and a further report would come to the <strong>Board</strong> in April 2011.<br />
F<br />
The <strong>Board</strong> welcomed, and noted, the comprehensive report and<br />
did not underestimate the amount of work involved. The <strong>Board</strong><br />
would receive a seminar to enable greater exploration of the<br />
issues involved and the Interim Director of Workforce would<br />
advise on timings.<br />
T<br />
Terms of Reference for <strong>Board</strong> Committees<br />
NEDs presented the Terms of Reference for the Finance,<br />
Performance & Investment Committee<br />
4 and the Safety & Quality<br />
Committee 5 for approval by the <strong>Board</strong>. As the new governance<br />
arrangements embedded, the Terms of Reference would be<br />
reviewed and refined to ensure the full scope of the Committees’<br />
IDW<br />
IDW<br />
4 Peter Burroughs on behalf of the Committee Chairman, Ian Douglas<br />
5 Lee Paschalides<br />
8
Item 2<br />
responsibilities were covered.<br />
NED challenged on:<br />
• How the roles of the new Committees and issues arising<br />
from them would be communicated across the <strong>Trust</strong>. 6<br />
Lee Budge stated that updates had been included in the<br />
monthly Team Briefing, but more could be done,<br />
particularly around operational structures so staff would<br />
know where to go should they have concerns. The<br />
importance of clinical engagement through Committee<br />
membership was acknowledged.<br />
• The importance of good information flows and systematic<br />
D<br />
• Reflection on the benefits of more ‘face to face’<br />
R<br />
The <strong>Board</strong> approved the Terms of Reference for the<br />
Finance, Performance<br />
A<br />
& Investment Committee and the<br />
Safety & Quality Committee.<br />
reporting.<br />
7 Clarification of the reporting and assurance<br />
structures below <strong>Board</strong> Committee level was ongoing and<br />
would be published when finalised.<br />
8<br />
communication. Lee Budge, the Interim Director of<br />
Workforce and the Head of Communications would<br />
consider this with regard to the leadership development<br />
programme and how to tap into existing meetings. NEDs<br />
offered their services to bring perspective.<br />
28/11 Appointment of Vice-Chairman<br />
The <strong>Board</strong> were asked to approve the appointment of Peter<br />
Burroughs as Vice-Chairman<br />
F<br />
of the <strong>Trust</strong>, effective 1 <strong>March</strong><br />
2011.<br />
The <strong>Board</strong> approved this appointment and noted Margaret<br />
Schwarz’s continued chairmanship of the Audit Committee.<br />
29/11 Register of <strong>Board</strong> Members’<br />
T<br />
Interests<br />
The Register of <strong>Board</strong> Members’ interests had been updated.<br />
Details would be published on the <strong>Trust</strong>’s website.<br />
The <strong>Board</strong> noted the report.<br />
6 Steven Jermy<br />
7 Lee Paschalides<br />
8 David Pond<br />
9
Item 2<br />
30/11 Chairman’s report from Finance, Performance & Investment<br />
Committee meeting, 16 February 2011<br />
NED 9 presented this in the absence of the FPIC Chairman. The<br />
Committee had been pleased with the level of detail provided<br />
and the Committee Chairman’s report covered the main points<br />
of discussion. The <strong>Board</strong>’s attention was drawn to the improved<br />
presentation of the cash position.<br />
The <strong>Board</strong> noted the report and were pleased with progress<br />
and with the level of assurances provided.<br />
31/11 Any Other Business<br />
D<br />
The Chairman stated that good communications with colleagues<br />
in primary care had<br />
R<br />
resulted in a sense of positive movement;<br />
there was some clarity in the short to medium term strategy and<br />
momentum was important. In the longer term, health community<br />
interaction would be a key focus.<br />
There was no other business.<br />
32/11 Chairman’s closing remarks<br />
The meeting closed at 3.45 pm.<br />
A<br />
F<br />
------------------------------------------------------------------------------------<br />
33/11 Date of next meeting<br />
Signed<br />
Friday 25 <strong>March</strong> 2011.<br />
Dated ------------------------------------------------------------------------------------<br />
T<br />
9 Peter Burroughs<br />
10
Updated: prior to <strong>March</strong> <strong>Board</strong> Item 4<br />
Outstanding Actions<br />
<strong>Plymouth</strong> <strong>Hospitals</strong> NHS <strong>Trust</strong><br />
Action List for <strong>Trust</strong> <strong>Board</strong> Part 1<br />
Date Ref Action Lead Comments<br />
25.02.11 24/11,<br />
page 7<br />
Draft Quality Account for review. AM Scheduled for<br />
<strong>March</strong> 2011 and<br />
included on<br />
agenda.<br />
25.02.11 25/11,<br />
page 8<br />
Equality & Diversity: the <strong>Public</strong><br />
Sector Equality Duty – update<br />
following effective date of 1 April<br />
2011.<br />
IDW<br />
Scheduled for<br />
April 2011.<br />
Completed Actions<br />
All completed actions have been<br />
previously recorded.<br />
Completed actions will be shown for one month only. 1
Item 5<br />
SUMMARY REPORT<br />
<strong>Trust</strong> <strong>Board</strong> Meeting (Part 1) 25 <strong>March</strong> 2011<br />
Subject<br />
Prepared by<br />
Approved by<br />
Presented by<br />
Chief Executive’s Report<br />
Chief Executive<br />
Chief Executive<br />
Chief Executive<br />
Purpose<br />
To update the <strong>Board</strong> on important current issues.<br />
Corporate Objectives<br />
Decision<br />
Approval<br />
Information<br />
Other<br />
Safety Quality Efficiency Workforce Health Governance<br />
• • •<br />
Executive Summary<br />
This report contains a briefing on:<br />
1. Theatre Safety<br />
2. Review of the Human Resources Directorate<br />
Key Recommendations<br />
1. The <strong>Board</strong> is asked to note this report.<br />
Assurance Framework<br />
This regular update provides information on issues covering the full range of the assurance<br />
framework.<br />
Next Steps<br />
This report is provided for information, there are no specific next steps.<br />
•<br />
Corporate Impact Assessment<br />
CQC Regulations CQC outcomes 4, 9, 14 and 16<br />
Financial Implications None directly.<br />
Legal Implications Potential further enforcement action.<br />
Equality & Diversity None directly.<br />
1
Item 5<br />
DETAILED REPORT<br />
<strong>Trust</strong> <strong>Board</strong> (Part 1) 25 <strong>March</strong> 2011<br />
Subject<br />
Prepared by<br />
Approved by<br />
Presented by<br />
Chief Executive’s Report<br />
Chief Executive<br />
Chief Executive<br />
Chief Executive<br />
Purpose<br />
To update the <strong>Board</strong> on important current issues.<br />
Background<br />
In the last month the focus of the executive team has mainly been on two issues: ensuring<br />
that the <strong>Trust</strong> complies with the compliance action of the Care Quality Commission (CQC) in<br />
relation to theatre safety and the completion of the annual operational plan, budget and<br />
savings programme. The annual operating plan is covered elsewhere on this agenda.<br />
The focus has now moved to ensuring that the delivery arrangements are in place for<br />
implementing the Operating Plan; both the quality and the business improvement<br />
dimensions. The team will also be focusing on taking forward the leadership development<br />
programme discussed by the <strong>Board</strong> last month.<br />
The highlight of the month has been the success of the Infection Control Team winning the<br />
national Nursing Times/Health Service Journal Patient Safety Award in the Infection Control<br />
and Hygiene Category. This is a tremendous achievement and reflects the hard work of the<br />
team (led by Claire Haill and Peter Jenks) and the many staff involved in the surgical<br />
infection surveillance programme for which the award was won.<br />
Patient safety is the top priority of the <strong>Trust</strong> and it is good to be able to show this through a<br />
high profile result such as this.<br />
Theatre Safety<br />
Last month I reported on the compliance action taken by the Care Quality Commission. The<br />
warning issued to the <strong>Trust</strong> required the organisation to be able to demonstrate compliance<br />
with “Outcome 4” by 22 <strong>March</strong>. When the <strong>Board</strong> meets it is possible that the CQC will have<br />
revisited the <strong>Trust</strong>. If so, there will be a verbal update at the meeting.<br />
The CQC will also be providing a full report of the visit that took place on the 16 February. It<br />
is likely that they will require an action plan to address other concerns raised in this report<br />
which were not covered in the warning already issued. The <strong>Trust</strong> is in regular contact with<br />
the CQC and has a clear idea of the actions which are likely to be required and is also<br />
addressing these.<br />
There has been a significant focus on ensuring that the weaknesses identified by the CQC<br />
are addressed. The programme is being led by Paul McArdle (Assistant Medical Director). A<br />
comprehensive action plan has been drawn up and is being monitored by a task group<br />
chaired by the Chief Executive. The action plan includes the development and<br />
implementation of a new, more comprehensive version of the WHO checklist, and the<br />
communication of this new version to all relevant staff. This is supported by training and<br />
discussion with key staff.<br />
2
A second “Continuing Medical Education” session was devoted to this subject and was<br />
attended by 197 senior clinicians and theatre staff. An excellent discussion took place. The<br />
senior management team is visiting the theatres frequently to discuss safety concerns with<br />
staff and the safety team is providing excellent support to the theatre management team and<br />
staff.<br />
Review of the Human Resources Directorate<br />
The <strong>Board</strong> has asked for an update on the review and restructure of Human Resources and<br />
Workforce Development Directorate.<br />
The restructure of this service has been completed which including the following services:<br />
• Human resources<br />
• Recruitment and retention<br />
• Temporary staffing<br />
• Medical staffing<br />
• Workforce development and planning<br />
• Training and education<br />
• Workforce information and planning<br />
• HR systems and processes<br />
The process involved putting over 70 staff through an assessment process for new roles<br />
based on the “HR business partner model”. The new structure will be led by a Director of<br />
Workforce and Organisational Development supported by a Deputy Director of Workforce<br />
and an Associate Director of Organisational Development.<br />
The new HR service model will be supported by a “centre of excellence” which will give HR<br />
advice and support through a team of HR professionals in the HR Direct team. There will be<br />
a team of HR business partners who will support operational managers on transformational<br />
change to support the workforce productivity agenda.<br />
The OD team will support education and training, Organisational Development, leadership<br />
development, workforce development and planning.<br />
The interim HR Director is working with the new teams to develop an implementation plan<br />
and will be working with Directorates on the new service model to ensure a seamless<br />
transition with a suite of new HR policies and procedures.<br />
This is an exciting time for the service, developing a Workforce and OD service to support<br />
workforce morale and productivity across the <strong>Trust</strong> and to meet the financial challenges<br />
ahead. This transformation programme has saved the <strong>Trust</strong> £0.5 million recurrently.<br />
The next stage will be to undertake a thorough review of Occupational Health and Payroll<br />
Services over the next few months.<br />
Recommendation<br />
1 The <strong>Board</strong> is asked to note this report<br />
3
Item 6<br />
SUMMARY REPORT<br />
<strong>Trust</strong> <strong>Board</strong> (Part 1) 25 <strong>March</strong> 2011<br />
Subject<br />
Prepared by<br />
Approved by<br />
Presented by<br />
The Development of Patient Pledges<br />
Jayne Davies, Service Planner<br />
Chief Nurse<br />
Chief Nurse<br />
Purpose<br />
To provide <strong>Board</strong> members with an update on the development of Patient<br />
Pledges as outlined in the Patient Experience Strategy which the <strong>Board</strong><br />
approved in December 2010. This strategy was written in response to the<br />
NHS Constitution (2010) and to support the delivery of the <strong>Trust</strong>’s Quality<br />
Strategy.<br />
Corporate Objectives<br />
Decision<br />
Approval<br />
Information<br />
Other<br />
Safety Quality Efficiency Workforce Health Governance<br />
• •<br />
Executive Summary<br />
The paper provides an update on the Patient Pledges which were outlined as a key<br />
deliverable within the <strong>Trust</strong>’s Patient Experience Strategy (Dec 2010). It provides a summary<br />
of the consultation which took place, the pledges or promises themselves and highlights the<br />
work that is still outstanding. Additionally, it provides a summary of our compliance with the<br />
NHS Patient Pledges contained within the NHS Constitution as at <strong>March</strong> 2011.<br />
Key Recommendations<br />
The key recommendation is that we now further engage with our staff in the implementation<br />
of the pledges or promises and seek to embed them within the organisation and the<br />
community, via a series of engagement sessions and communication activity.<br />
Assurance Framework<br />
There are clear links between the NHS Constitution, PHNT and PCT performance. There are<br />
also links with CQC evaluations e.g. patient & staff surveys. Patient and <strong>Public</strong> Involvement<br />
and patient experience in general.<br />
Next Steps<br />
Sense check the pledges/promises with staff and engage staff in the development of a<br />
framework which will describe the behaviours and competencies which staff will need to<br />
demonstrate for each pledges. This will be done via a series of engagement sessions with<br />
staff.<br />
•<br />
Corporate Impact Assessment<br />
CQC Regulations 9, 10, 11, 12,15,17, 21, 23 & 24.<br />
Financial Implications<br />
Legal Implications<br />
Equality & Diversity<br />
None.<br />
The NHS Constitution is now backed by law which means that NHS organisations<br />
are legally obliged to take account of the rights and pledges set out in the NHS<br />
Constitution.<br />
There are no direct implications for health inequalities in this paper. The NHS<br />
Constitution takes account of health inequalities and access to services for all<br />
groups, which is enshrined within the Constitution.<br />
1
Item 6<br />
DETAILED REPORT<br />
<strong>Trust</strong> <strong>Board</strong> (Part 1) 25 <strong>March</strong> 2011<br />
Subject<br />
Prepared by<br />
Approved by<br />
Presented by<br />
The Development of Patient Pledges<br />
Jayne Davies – Service Planner<br />
Chief Nurse<br />
Chief Nurse<br />
Purpose<br />
To provide <strong>Board</strong> members with an update on the development of Patient Pledges as<br />
outlined in the Patient Experience Strategy which the <strong>Board</strong> approved in December 2010.<br />
This strategy was written in response to the NHS Constitution (2010) and to support the<br />
delivery of the <strong>Trust</strong>’s Quality Strategy).<br />
Background<br />
From January 2010, all NHS organisations are legally obliged to take account of the rights<br />
and pledges set out in the NHS Constitution. The pledges, although not legally binding,<br />
represent a commitment to provide high quality of services and a high quality workforce.<br />
The publication of the Patient Experience Strategy 2010 – 2013 clearly sets out our response<br />
to the requirements of the national and strategic guidance around providing the best possible<br />
patient experience, to which both NHS and <strong>Plymouth</strong> <strong>Hospitals</strong> NHS <strong>Trust</strong> is committed.<br />
The Patient Experience Strategy approved by the <strong>Trust</strong> <strong>Board</strong> in December 2010 describes<br />
our approach to supporting the delivery of the “Personal Care” element of the <strong>Trust</strong>’s Quality<br />
Strategy (Dec 2010) and sets out a three year programme of work that will see the <strong>Trust</strong><br />
continuously listening to patients, evaluating feedback and acting upon it in a systematic<br />
way.<br />
As part of this programme, work has been undertaken specifically around developing a set of<br />
patient pledges or promises, or short statements of service standards that epitomise what<br />
‘good’ patient experience should mean and which all staff can sign up to.<br />
The promises have been developed through consultation with patients and staff about what<br />
good quality patient care should look like at the <strong>Trust</strong>. Consultation activity has been<br />
undertaken as follows:<br />
• A postal questionnaire to 800c Foundation <strong>Trust</strong> ‘members’ about what aspects of<br />
care were most important to them (October 2010).<br />
• Face to face interviews with 100 members of the public at the Healthy <strong>Plymouth</strong><br />
event about what good quality care looks like (October 2010).<br />
• Interactive session with Foundation <strong>Trust</strong> ‘members’ to define key dimensions of<br />
good quality care (November 2010).<br />
• Feedback sessions with <strong>Trust</strong> ‘Governors’ (October 2010 and <strong>March</strong> 2011).<br />
• Three staff forum sessions focusing on quality of patient care (June to September<br />
2010).<br />
2
Item 6<br />
These engagement sessions have enabled us to simplify the pledges set out in the NHS<br />
Constitution and to put them into context for our patients, community and organisation as a<br />
set of ‘Patient Promises’.<br />
Our challenge now is to ensure that every member of staff makes a commitment to the<br />
following promises:<br />
1. I will… care for you compassionately and respectfully<br />
2. I will… give you clear information and involve you in your care<br />
3. I will… give you the best treatment I can when you need it<br />
4. I will… make sure you are treated in a clean and safe environment<br />
Next Steps<br />
The plan is now to sense check these promises with staff and engage them in the<br />
development of a framework which will describe the behaviours and competencies which<br />
staff will need to demonstrate for each pledge.<br />
These promises will then be communicated and embedded into the organisation, supported<br />
by the Organisational Development Programme to ensure they become part of our culture<br />
both now and in the future.<br />
Engagement sessions will shortly be held with key groups e.g. Clinical Directors, Directorate<br />
Managers, Medical Secretaries Forum and some open breakfast meetings with staff.<br />
Staff will be asked to prioritise a series of suggestions on the top five behaviours, which will<br />
demonstrate their commitment to meeting each of our promises. When these behaviours<br />
have been determined, staff will be asked to make a commitment to them and acknowledge<br />
their integration into their own personal performance management and responsibility.<br />
It is envisaged that these promises will become central to our organisation and widely used,<br />
with objectives, work programmes and measureable outcomes and targets mapped to each<br />
promise.<br />
It is recognised that improving the patient experience requires the continued support and<br />
involvement of staff. These patient promises provide a driving force and visual vehicle which<br />
will help staff to develop the behaviours required to promote a quality focused culture in<br />
which they can be justly proud.<br />
The NHS Constitution also outlines pledges to staff. Consideration needs to be given as to<br />
whether staff pledges need to be launched at the same time as those for patients or should<br />
be managed as a separate matter and tied into the Organisational Development Programme.<br />
The current compliance to the NHS Constitution Patient Pledges and work that has been<br />
completed, alongside work outstanding is set out in (Annex 1) for information.<br />
Conclusion and recommendations<br />
The <strong>Board</strong> is asked to note the work carried out to date and the next steps.<br />
3
Item 6<br />
NHS Constitution Patient Pledges Annex 1<br />
Patient Pledge <strong>March</strong> 2011 Declaration Working outstanding Compliance<br />
The NHS commits to provide<br />
convenient, easy access to services<br />
within waiting times set out in the<br />
Handbook to the NHS Constitution<br />
To make decisions in a clear and<br />
transparent way so that patients and the<br />
public can understand how services are<br />
planned and delivered<br />
To make the transition as smooth as<br />
possible when you are referred between<br />
services and to include you in relevant<br />
discussions.<br />
To ensure that services are provided in<br />
a clean and safe environment that is fit<br />
for purpose on national best practice.<br />
To provide continuous improvement in<br />
the quality of services you receive<br />
identifying and sharing best practice in<br />
quality of care and treatments.<br />
To share with you any letters sent<br />
between clinicians about your care<br />
Compliance with all waiting list targets Fully<br />
complaint<br />
Patient engagement and consultation<br />
undertaken to define promise No. 2<br />
Patient engagement and consultation<br />
undertaken to define promise No. 1 & 2<br />
Adherence to referral criteria’s and<br />
compliance to referral pathways.<br />
Patient engagement and consultation<br />
undertaken to promise No. 4<br />
External audit by the CQC<br />
Patient engagement and consultation<br />
undertaken to promise No. 3<br />
Letters available if requested and clinically<br />
appropriate<br />
Communicate promises to staff across the<br />
organisation and gain their engagement<br />
and ownership of this promise.<br />
<strong>Public</strong> Relations strategy required to<br />
determine how the message is both given<br />
and received by patients<br />
The NHS constitution and what it means<br />
to staff needs to be incorporated into the<br />
<strong>Trust</strong> Induction programme.<br />
As above<br />
Continue to adhere to referral criteria’s<br />
and comply with pathway referral.<br />
Full Implementation of the Patient<br />
Experience Strategy<br />
As above<br />
Full Implementation of the Patient<br />
Experience Strategy<br />
As above<br />
Full Implementation of the Patient<br />
Experience Strategy<br />
Partially<br />
complaint<br />
Partially<br />
compliant<br />
Partially<br />
compliant<br />
Partially<br />
compliant<br />
Fully<br />
compliant<br />
4
Item 6<br />
Patient Pledge <strong>March</strong> 2011 Declaration Working outstanding Compliance<br />
To inform you about the healthcare<br />
services available to you and offer easily<br />
accessible, reliable and relevant<br />
information<br />
To provide you with the information you<br />
need to influence and scrutinise the<br />
planning and delivery of NHS services<br />
and to work in partnership with you, your<br />
family, carers and representatives<br />
To ensure you are treated with courtesy<br />
and you receive appropriate support<br />
when making a complaint<br />
When mistakes happen, to acknowledge<br />
them, apologise, explain what went<br />
wrong and put things right quickly and<br />
effectively<br />
To ensure that the organisation learns<br />
lessons from complaints and claims and<br />
uses these to improve NHS services<br />
Patient engagement and consultation<br />
undertaken to promise No. 2<br />
Patient engagement and consultation<br />
undertaken to promise No. 2<br />
Meet all mandatory information<br />
requirements<br />
Patient engagement and consultation<br />
undertaken to promise No. 1<br />
New policy and procedures to deal with<br />
complaints<br />
Patient engagement and consultation<br />
undertaken to promise No. 1, 3 and 4<br />
New policy and procedures to deal with<br />
complaints<br />
Patient engagement and consultation<br />
undertaken to promise No. 1, 3 and 4<br />
New policy and procedures to deal with<br />
complaints<br />
As above<br />
Full Implementation of the Patient<br />
Experience Strategy<br />
Review of patient information planned for<br />
2011-12<br />
As above<br />
Full Implementation of the Patient<br />
Experience Strategy<br />
As above<br />
Full Implementation of the Patient<br />
Experience Strategy<br />
New complaint’s policy, procedures and<br />
targets to be further embedded<br />
As above<br />
Full Implementation of the Patient<br />
Experience Strategy<br />
New complaint’s policy, procedures and<br />
targets to be further embedded<br />
As above<br />
Full Implementation of the Patient<br />
Experience Strategy<br />
New complaint’s policy, procedures and<br />
targets to be further embedded<br />
Partially<br />
compliant<br />
Partially<br />
compliant<br />
Partially<br />
compliant<br />
Partially<br />
compliant<br />
Partially<br />
compliant<br />
5
Item 7<br />
<strong>Plymouth</strong> <strong>Hospitals</strong> NHS <strong>Trust</strong><br />
SUMMARY REPORT<br />
<strong>Trust</strong> <strong>Board</strong> (Part 1) 25 <strong>March</strong> 2011<br />
Subject Quality Account 2010/2011<br />
Prepared by<br />
Approved by<br />
Presented by<br />
<strong>Board</strong> Secretary<br />
Medical Director<br />
Medical Director<br />
Purpose<br />
To update the <strong>Board</strong> on progress with the completion of the Quality Account<br />
and to seek the <strong>Board</strong>’s views on the draft document.<br />
<strong>Trust</strong> Objectives<br />
Decision<br />
Approval<br />
Information<br />
Other<br />
Safety Quality Efficiency Workforce Health Governance<br />
•<br />
Executive Summary<br />
The <strong>Trust</strong> is required to publish an annual Quality Account and to agree priorities for inclusion<br />
in the Quality Account 2010/2011. In February, the <strong>Board</strong> approved the priorities for inclusion<br />
in the document. The purpose of a Quality Account is threefold: firstly, as an important<br />
document that will enable the public to hold NHS <strong>Trust</strong>s to account for the quality of the NHS<br />
healthcare services they provide; secondly, to enable <strong>Trust</strong> <strong>Board</strong>s to focus on quality<br />
improvement as a core function; and finally, to assist patients and their carers to make fully<br />
informed choices about their healthcare. The production of this document is an iterative<br />
process and the <strong>Board</strong> is presented with a draft for review.<br />
Key Recommendations<br />
1. The <strong>Board</strong> is asked to note progress on the draft Quality Account, to review it and to<br />
comment.<br />
•<br />
Assurance Framework<br />
Links to the Quality objectives in the Assurance Framework.<br />
Next Steps<br />
Feedback on the draft Quality Account is required from external stakeholders (<strong>Plymouth</strong><br />
Overview & Scrutiny Committee, Cornwall Overview & Scrutiny Committee, Local<br />
Involvement Network and NHS <strong>Plymouth</strong>) in a consultation process and the final Quality<br />
Account will come to the April <strong>Trust</strong> <strong>Board</strong> for approval.<br />
Corporate Impact Assessment<br />
CQC Regulations N/A<br />
Financial Implications To be determined as part of routine performance review.<br />
Legal Implications The <strong>Trust</strong> has a statutory duty to publish a Quality Account.<br />
Equality & Diversity To be considered in the discharge of the priorities identified.<br />
1
Item 7<br />
<strong>Plymouth</strong> <strong>Hospitals</strong> NHS <strong>Trust</strong><br />
Draft Quality Account 2010-11<br />
Part 1 - Introduction to Our Service<br />
1.1 Welcome and Message from Chief Executive<br />
Welcome to our Quality Account for 2010-11, another year of real challenge and<br />
achievement, characterised by a commitment from our teams to deliver high quality patient<br />
care.<br />
The quality and safety of the patient experience is central to all that we do. We do not always<br />
get it right, but there are many indications that we continue to improve. These Quality<br />
Accounts reflect our achievement against our goals for 2010-11 and show areas where we<br />
know we still need to improve.<br />
We are particularly proud that we continue to be one of the best performers nationally on<br />
infection control with dramatically falling rates of MRSA and C.Diff. The <strong>Trust</strong> is among the<br />
best hospitals in the country for patient outcomes, according to a report by the independent<br />
body, Dr Fosters. We have unconditional registration with the Care Quality Commission<br />
which assesses us on over fifty patient related features – including cleanliness with which we<br />
have struggled in the past.<br />
Waiting times continue to fall. We achieved the Emergency Department 4 hour target, the 18<br />
week maximum wait for inpatient treatment, the six week diagnostic wait, and the range of<br />
cancer targets.<br />
The independent patient survey shows that almost 80% of our patients rate their treatment<br />
as excellent or good. Mums-to-be and their families can be confident that maternity care in<br />
<strong>Plymouth</strong> is good and, in parts among the best in the country according to the patients who<br />
use them.<br />
A Care Quality Commission report has rated <strong>Plymouth</strong> stroke services amongst the best in<br />
the Country. The <strong>Trust</strong> has a direct admission for patients to a dedicated stroke unit at<br />
Derriford Hospital where they are cared for by a specialist team of staff.<br />
In placing quality patient services at the centre of what we do we have developed four patient<br />
promises, drawn up with the help of patients and staff. These provide a driving force behind<br />
our efforts to establish our hospital as the first choice for care. The promises focus on what<br />
matters most to patients like providing clean and safe environments and providing clear<br />
information to patients.<br />
This level of continued progress represents a significant achievement by all staff of the <strong>Trust</strong><br />
during 2010-11 and provides us with a strong platform from which to address the challenges<br />
that we face in the year ahead.<br />
We are proud of all our staff and volunteers for the great contribution they have made to the<br />
delivery of high quality patient care over the past year.<br />
Sarah Widnell / Jayne Glynn V7 21.03.11 1
Item 7<br />
1.2 Statement by Chief Executive<br />
The content of this Quality Account was approved by the <strong>Board</strong> of Directors on 25 <strong>March</strong><br />
2011 and to the best of my knowledge the information contained within is accurate.<br />
Signed by Paul Roberts, Chief Executive<br />
Sarah Widnell / Jayne Glynn V7 21.03.11 2
Item 7<br />
Part 2 - Information Required by Regulation<br />
2.1 Priorities for improvement 2011-12<br />
We are committed to continually driving up the quality of our services and have carefully<br />
considered where we need to improve this year. These areas have been identified through<br />
reviewing our performance in 2010-11 and considering national and local priorities.<br />
The <strong>Trust</strong> has developed goals based around the three important aspects of quality care<br />
which it has defined as:<br />
• Safe Care<br />
• Effective Care<br />
• Personal Care<br />
High level quality ambitions for the <strong>Trust</strong> based around these three areas have been<br />
developed through the <strong>Trust</strong>’s Quality Strategy developed during 2010-11. The <strong>Trust</strong> will<br />
review this strategy annually and achievements and one year priorities will be published<br />
within this document annually.<br />
The key priorities for 2011-12 have been developed to support the delivery of our patient<br />
promises which are:<br />
• Caring for you compassionately and respectfully<br />
• Giving you clear information and involving you in your care<br />
• Giving you the best treatment we can when you need it<br />
• Making sure you are treated in a clean and safe environment<br />
We have set five key priorities areas for improvement in 2011/12:<br />
Domain Priority Rationale<br />
Safe Care<br />
Effective Care<br />
Personal Care<br />
• Reduce avoidable harm through<br />
improved levels of learning from<br />
incidents and complaints<br />
• Appropriate handover and escalation<br />
during patient management<br />
• Ensure effective pathways of patient<br />
care across the health community –<br />
appropriate follow up, continuity of<br />
clinical care, reducing length of stay,<br />
reducing delayed discharges<br />
• Ensure optimal outcomes of care<br />
through delivery of evidence based<br />
best practice<br />
• Improve overall patient satisfaction,<br />
based on results of inpatient survey,<br />
and aim for the upper quartile for all<br />
NHS <strong>Hospitals</strong>.<br />
To continuously improve<br />
services to ensure when<br />
things go wrong lessons are<br />
learnt and changes are<br />
made.<br />
To ensure early detection<br />
and appropriate escalation of<br />
unwell patients.<br />
Every aspect of patient care<br />
contributes to a minimum<br />
time for recovery and length<br />
of stay in hospital<br />
Adopting best practice<br />
provides the maximum<br />
opportunity to provide the<br />
best outcome for patients.<br />
Listening to patients and<br />
acting on their concern to<br />
make improvements.<br />
Sarah Widnell / Jayne Glynn V7 21.03.11 3
Item 7<br />
The five priorities were developed following discussions with various groups within the <strong>Trust</strong>,<br />
including the Safety & Quality Committee, before agreement at the <strong>Trust</strong> <strong>Board</strong>. The <strong>Trust</strong>’s<br />
‘governors in waiting’, recruited in preparation for our Foundation <strong>Trust</strong> application, were also<br />
consulted.<br />
Priority 1 – Reduce avoidable harm through improved levels of learning from incidents<br />
and complaints<br />
It is acknowledged nationwide that despite our best efforts patients suffer harm in hospital<br />
and many other patient narrowly avoid a similar experience, a ‘near miss’. Our first priority is<br />
aimed at reducing overall levels of harm and continuous improvement of services to ensure<br />
when things go wrong lessons are learnt and changes are made.<br />
How will we do it?<br />
We will collect information when things go wrong. Through reporting and analysis of adverse<br />
events using the root cause analysis tool, which allows us to identify the core issues and to<br />
learn lessons we will aim to preventing a reoccurrence. To support this approach root cause<br />
analysis training will be introduced for staff groups to identify true causes of harm.<br />
The <strong>Trust</strong> would encourage increased reporting of no harm or near miss incidents to enable<br />
to learning, a large proportion of near miss reflects a strong organisational reporting culture<br />
where potential problems are identified and action taken to prevent harm.<br />
The standard approach to reporting of adverse events, relies on voluntary, self reporting of<br />
incidents and is known to only identify 10 to 20% of adverse occurrences. In order to<br />
supplement this process the <strong>Trust</strong> has adopted the global trigger tool (GTT) to measure and<br />
identify events that cause harm to patients. It is a casenote review tool that enables the<br />
<strong>Trust</strong> to understand and measure adverse events and rates of harm, whereby a severity<br />
rating is assigned to each adverse event.<br />
A multi-disciplinary clinical team have been trained in how to conduct the GTT casenote<br />
review according to a pre-defined template. Members of this team meet fortnightly to ‘double<br />
review’ 20 sets of randomly selected noted each month.<br />
How will we measure it?<br />
GTT monthly data will be reviewed on a monthly basis alongside regular mortality data<br />
through the Clinical Governance Steering Group.<br />
Monitor <strong>Trust</strong> performance using Dr Foster data and incident reporting trends from the<br />
National Reporting and Learning System (NRLS).<br />
% reduction in the number of grade 3 pressure ulcers<br />
% reduction in the number of patient falls<br />
% reduction in surgical site infection<br />
% reduction of infections secondary to urinary catheters<br />
% reduction in the incidence of VTE<br />
% to be confirmed<br />
How will we report it?<br />
Regular monthly incident and complaints reports will be submitted to the <strong>Trust</strong>’s Safety &<br />
Quality Committee. Additional quarterly reports on progress against the global trigger tool<br />
will be submitted to the Clinical Governance Steering Group.<br />
Sarah Widnell / Jayne Glynn V7 21.03.11 4
Item 7<br />
Priority 2 - Appropriate handover and escalation during patient management<br />
Identification of the deteriorating patient and ensuring appropriate escalation and response is<br />
an essential aspect of patient care. The <strong>Trust</strong> has developed an action plan to improve the<br />
care of deteriorating patients and reduce the number of cardiac arrests, which includes a<br />
colour banded observation chart for the early detection and appropriate escalation of unwell<br />
patients.<br />
How will we do it?<br />
The <strong>Trust</strong> has developed an action plan to improve the care of deteriorating patients and<br />
reduce the number of cardiac arrests, which includes a colour banded observation chart for<br />
the early detection and appropriate escalation of unwell patients. Patients that trigger on the<br />
observation chart will be added to the ward whiteboard and discussed at the daily safety<br />
briefing which have been introduced to ensure structured handover of key patient information<br />
including key principles Situation, Background, Assessment and Recommendation (SBAR).<br />
All cardiac arrests calls will be investigated to identify aspects of care which may have<br />
attributed to preventable deterioration.<br />
We will ensure that patient observations are carried out in a timely manner and that all<br />
deteriorating patients are appropriately escalated to ensure action is taken.<br />
How will we measure it?<br />
The percentage of patient who trigger on the Early Warning System and receive an<br />
appropriate response will be monitored monthly, alongside the number of rapid response<br />
calls made per month. These figures will provide assurance that when a patient deteriorates<br />
appropriate escalation has taken place.<br />
We will monitor the frequency and percentage of wards using daily safety briefings, to assess<br />
the communication methods used to handover patient information.<br />
The number of cardiac arrest calls will be monitored monthly to ascertain how many were<br />
avoidable. In addition the <strong>Trust</strong> subscribes to the Dr Foster mortality database, which<br />
predicts the Hospital Standardised Mortality Ratio (HSMR) which is an indicator of healthcare<br />
quality that measures whether the death rate at a hospital is higher or lower than you would<br />
expect.<br />
% reduction in the number of cardiac arrest calls<br />
% increase in the number of rapid response calls<br />
Increase the % of patients who trigged on the EWS and receive an appropriate response<br />
Increase the frequency and percentage of wards using daily safety briefings<br />
% to be confirmed<br />
How will we report it?<br />
Regular monthly reports will be submitted to the Clinical Governance Steering Group and<br />
quarterly reports submitted to the <strong>Trust</strong>’s Safety & Quality Committee. Additional monthly<br />
reports on progress will be submitted to the SHA.<br />
Priority 3 - Ensure effective pathways of patient care across the health community,<br />
appropriate follow up, continuity of clinical care, reducing length of stay and reducing<br />
delayed discharges<br />
As a Health Community there is a requirement to make efficiencies throughout elective care,<br />
in order to improve both the patient experience and to reduce costs.<br />
Sarah Widnell / Jayne Glynn V7 21.03.11 5
Item 7<br />
How will we do it?<br />
The Enhanced Recovery Programme is currently being implemented in the four main<br />
specialties, Colorectal, Orthopaedics, Urology and Gynaecology, across the <strong>Trust</strong>. In<br />
addition to this the Quality, Innovation, Productivity and Prevention (QIPP) Programme<br />
identifies Enhanced Recovery as a key area through which quality improvement and savings<br />
can be delivered.<br />
It is important to implement best practice because:<br />
• The patient will be in the best possible condition for surgery i.e. managing pre existing comorbidities<br />
in Primary Care<br />
• The patient has the best possible management during and after the operation i.e.<br />
minimally invasive surgery, reduced starvation and fluid management<br />
• The patient has the best post-operative rehabilitation i.e. planned mobilisation, improved<br />
pain relief<br />
The <strong>Trust</strong> has introduced the Outpatient Efficiency Work Programme to improve and<br />
streamline the administration process and provide a better experience for patients.<br />
How will we measure it?<br />
% reduction in patient average length of stay<br />
% reduction in the number of delayed discharges<br />
% reduction of the follow up waiting list backlog<br />
% reduction in the number of patient waiting for repatriation<br />
% to be confirmed<br />
How will we report it?<br />
Progress will be reported through the <strong>Trust</strong> <strong>Board</strong> performance databook on a monthly basis.<br />
In addition monthly progress reports will be submitted for review at the Enhanced Recovery<br />
Steering Group (ERSG).<br />
Priority 4 - Ensure optimal outcomes of care through delivery of evidence based<br />
practice<br />
The <strong>Trust</strong> recognises that adopting best practice provides the maximum opportunity to<br />
ensure optimal outcomes for patients. There are a number of key healthcare organisations<br />
who are responsible for identifying best practice, which is shared through a variety of reports<br />
and guidance.<br />
We will ensure that all information is assessed and key recommendations identified for<br />
implementation at <strong>Plymouth</strong> <strong>Hospitals</strong> NHS <strong>Trust</strong>.<br />
How will we do it?<br />
The <strong>Trust</strong> will ensure all national guidance is effectively assessed and implemented<br />
throughout the organisation with the full engagement of clinical staff.<br />
National Guidance including:<br />
• NICE Clinical Guidelines, Interventional Procedure Guidance, Technology Appraisal<br />
Guidance and <strong>Public</strong> Health Guidance<br />
• National Confidential Enquiries in Peri-Operative Deaths (NCEPOD) – ‘Age Old Problem’<br />
and ‘Mixed Bag’<br />
• National Patient Safety Agency (NPSA) Alerts and Reports<br />
• Royal College and Professional Society Guidance and Reports<br />
Sarah Widnell / Jayne Glynn V7 21.03.11 6
Item 7<br />
How will we measure it?<br />
Implementation will be measured through clinical audit, focusing on NICE Guidance and new<br />
interventional procedures and continuous assessment of key clinical outcomes. The <strong>Trust</strong><br />
has an approved Annual Clinical Audit Plan to be delivered for the period 2011-12.<br />
Compliance rates will be monitored through the Healthcare Governance Team for all NICE<br />
guidance and NPSA reports.<br />
Increased level of compliance for NICE Guidance<br />
% reduction in the incidence of VTE<br />
% to be confirmed<br />
How will we report it?<br />
Regular quarterly reports submitted to the <strong>Trust</strong>’s Safety & Quality Committee. Additional<br />
quarterly reports detailing progress against the overall NICE Guidance submitted to the<br />
Clinical Governance Steering Group and NHS <strong>Plymouth</strong>.<br />
Priority 5 - Improve overall patient satisfaction, based on results of inpatient surveys,<br />
and aim for the upper quartile for all NHS <strong>Hospitals</strong><br />
We believe that patients have the right to be treated in an environment that makes them feel<br />
safe and cared for. We will listen to patients and act on their concerns to make<br />
improvements, with the aim that patients will leave us having had a positive experience and<br />
will recommend us to people they know.<br />
How will we do it?<br />
Every month we will ask patients if they are happy with the care they received through a<br />
programme of continuous local inpatient surveys. Survey results will be shared with the<br />
relevant teams who will be asked to develop action plans addressing the key issues raised.<br />
The National Inpatient Survey provides an annual view of patient experience and our goal for<br />
2011/12 will be to improve the percentage of patients who rated the care received as<br />
excellent in the National Inpatient survey.<br />
We will deliver the Nursing High Impact Actions which consist of the following key elements:<br />
• Staying Safe – preventing falls<br />
• Your Skin Matters<br />
• Keeping Nourished – getting better<br />
• Promoting Normal Birth<br />
• Where to die when the time comes<br />
• Fit and Well to Care<br />
• Ready to Go – no delays<br />
• Protection from Infection<br />
The <strong>Trust</strong> is working with the Strategic Health Authority to implement the Equality Delivery<br />
System, a new Department of Health initiative.<br />
How will we measure it?<br />
Local and national inpatient survey findings are compiled into our patient experience action<br />
plan which is monitored to ensure effective changes are being made.<br />
Sarah Widnell / Jayne Glynn V7 21.03.11 7
Item 7<br />
Nursing dashboards are currently being developed and will be used to monitor activity<br />
against a number of set criteria during 2011-12.<br />
We will aim to improve our response rate for ‘excellent’ in the National Inpatient Survey by<br />
10%<br />
2009 2010<br />
Overall, how would you rate the care you have received 51% 48%<br />
Threshold for highest scoring 20% of NHS <strong>Trust</strong> 44% 44%<br />
Improved overall % in the national inpatient survey<br />
Improved provision of single sex accommodation<br />
Improved engagement with patients in decision about their care<br />
% to be confirmed<br />
How will we report it?<br />
Regular update reports will be submitted to the <strong>Trust</strong>’s Improving Through Listening Steering<br />
Group and quarterly reports will be submitted to the Safety & Quality Committee.<br />
2.2 Statements relating to quality of NHS services provided<br />
During 2010-11 <strong>Plymouth</strong> <strong>Hospitals</strong> NHS <strong>Trust</strong> provided and/or sub contracted 64 NHS<br />
services.<br />
The <strong>Trust</strong> has reviewed all data available to us on quality of care in all these NHS services.<br />
The income generated by the NHS services reviewed in 2010-11 represents 100% of the<br />
total income generated from the provision of NHS services by <strong>Plymouth</strong> <strong>Hospitals</strong> NHS <strong>Trust</strong><br />
for 2010-11.<br />
2.3 Review of data on quality care<br />
Participation in Clinical Audit and National Confidential Enquiries<br />
During 2010-11 <strong>Plymouth</strong> <strong>Hospitals</strong> NHS <strong>Trust</strong> participated in 106 <strong>Trust</strong> wide and local<br />
clinical audits, this is an increase in coverage from the previous year. The results of all<br />
clinical audits were presented to and reviewed by the appropriate staff within the <strong>Trust</strong> over<br />
the course of the year. The table below summarises the high level reporting arrangements<br />
for key aspects of Clinical Audit results.<br />
The results of <strong>Trust</strong>-wide audits are reported and reviewed to the following groups:<br />
• 12 audits were reviewed and discussed at the <strong>Trust</strong>’s Health Records Committee<br />
• 3 audits were reviewed and discussed at the <strong>Trust</strong>’s Medical Devices Steering Group<br />
• 3 audits were reviewed and discussed at the Clinical Governance Steering Group<br />
• ? audits were reviewed and discussed at the <strong>Trust</strong>’s Audit Committee<br />
• All local audits are reviewed and discussed at the relevant directorate meeting<br />
The results of all local audits are reviewed and discussed at the relevant directorate meeting.<br />
The Clinical Audit Support Team is further developing its processes during 2011/12 and has<br />
developed, with the support of the Medical Director, a corporate trust wide plan for the<br />
coming year. The current Clinical Audit Policy is also in the process of being reviewed to<br />
reflect current practice.<br />
Sarah Widnell / Jayne Glynn V7 21.03.11 8
Item 7<br />
In addition the national clinical audits and national confidential enquiries that <strong>Plymouth</strong><br />
<strong>Hospitals</strong> NHS <strong>Trust</strong> participated in, and for which data collection was completed during<br />
2010-11 are listed below.<br />
National Clinical Audits<br />
<strong>Plymouth</strong> <strong>Hospitals</strong> NHS <strong>Trust</strong> participated in and reported on 24 national audits, the reports<br />
of which were reviewed by the provider in 2010-11, full details of National Audits can be<br />
found at www.nao.org.uk. The Clinical Audit Support Team is developing improved links with<br />
clinical directorates and the Healthcare Governance Team to ensure participation in National<br />
clinical audits is recorded and resulting learning opportunities disseminated.<br />
National Audit Title<br />
Peri and Neonatal<br />
Perinatal Mortality (CMACE)<br />
Neonatal Intensive and Special Care (NNAP)<br />
Paediatrics<br />
Paediatric Fever<br />
Childhood Epilepsy<br />
Paediatric Diabetes<br />
Acute Care<br />
Adult Non-invasive Ventilation (NIV)<br />
Pneumonia<br />
Cardiac Arrest<br />
Long Term Conditions<br />
Diabetes – Adult<br />
Heavy Menstrual Bleeding (HMB)<br />
Adult Asthma<br />
Ulcerative Colitis and Crohn’s Disease<br />
COPD<br />
Inflammatory Bowel Disease (IBD)<br />
Cystic Fibrosis<br />
Elective Procedures<br />
Hip, Knee and Ankle Replacements (National Joint Registry)<br />
Cartoid Interventions<br />
Elective Surgery (PROMS)<br />
Abdominal Aortic Aneurysm<br />
Cardiovascular Disease<br />
Stroke Care<br />
Acute Stroke?<br />
Renal Disease<br />
Acute Kidney Injury<br />
Vascular Access<br />
Renal Transport Survey<br />
Cancer<br />
Lung Cancer<br />
Bowel Cancer<br />
Mastectomy and Breast Reconstruction<br />
Trauma<br />
Falls and Non Hip Fractures – National Audit of falls and<br />
bone health in older people<br />
Hip Fracture<br />
Status<br />
Completed<br />
Completed<br />
In Progress<br />
In Progress<br />
On going<br />
Completed<br />
In progress<br />
In progress<br />
In progress<br />
In progress<br />
Completed<br />
In progress<br />
In progress<br />
In progress<br />
In progress<br />
Completed<br />
Completed<br />
In progress<br />
In progress<br />
Completed<br />
In progress<br />
In progress<br />
In progress<br />
In progress<br />
In progress<br />
In progress<br />
Completed<br />
In progress<br />
Completed<br />
Sarah Widnell / Jayne Glynn V7 21.03.11 9
Item 7<br />
Severe Trauma ( TARN)<br />
Psychological Conditions<br />
Dementia<br />
Blood Transfusions<br />
O Neg Blood Use<br />
Platelet Use<br />
In progress<br />
In progress<br />
In progress<br />
In progress<br />
National Confidential Enquiries<br />
During 2010/11, 6 national confidential enquiries covered NHS services that <strong>Plymouth</strong><br />
<strong>Hospitals</strong> NHS <strong>Trust</strong> provides. Full details of national confidential enquiries can be found at<br />
www.ncepod.org.uk.<br />
The national confidential enquiries that <strong>Plymouth</strong> <strong>Hospitals</strong> <strong>Trust</strong> participated in and reported<br />
during 2010/11 are as follows:<br />
NCEPOD studies – reported in year<br />
Title of study<br />
An Age Old Problem - Emergency<br />
Surgery in the Elderly<br />
A Mixed Bag - Parental Nutrition<br />
Action taken<br />
Report recommendations and implications for<br />
the <strong>Trust</strong> considered by lead clinicians for<br />
further action.<br />
Report and recommendations considered by<br />
the <strong>Trust</strong>’s Nutritional Team.<br />
The national confidential enquiries that <strong>Plymouth</strong> <strong>Hospitals</strong> NHS <strong>Trust</strong> participated in, and for<br />
which data collection was completed or commenced during the 2010/11, are listed below<br />
alongside the number of cases submitted to each audit or enquiry as a percentage of the<br />
number of registered cases required by the terms of that audit or enquiry<br />
NCEPOD studies – data collection (100% participation in relevant studies)<br />
Title of study<br />
No. of cases<br />
submitted<br />
Percentage required by<br />
enquiry<br />
Cardiac Arrest Procedures 8 100%<br />
Surgery In Children 18 100%<br />
2.4 Participation in Clinical Research<br />
The number of patients receiving NHS services provided by <strong>Plymouth</strong> <strong>Hospitals</strong> NHS <strong>Trust</strong> in<br />
2010-11 that were recruited during that period to participate in research approved by a<br />
research ethics committee was 3300.<br />
Participation in clinical research demonstrates <strong>Plymouth</strong> <strong>Hospitals</strong> NHS <strong>Trust</strong>’s commitment<br />
to improving the quality of care we offer and to making our contribution to wider health<br />
improvement. Our clinical staff stay abreast of the latest possible treatment possibilities and<br />
active participation in research leads to successful patient outcomes.<br />
Sarah Widnell / Jayne Glynn V7 21.03.11 10
Item 7<br />
2.5 Goals agreed with commissioners<br />
<strong>Plymouth</strong> <strong>Hospitals</strong> NHS <strong>Trust</strong> income in 2010-11 was not conditional on achieving quality<br />
improvement and innovation goals through the Commissioning for Quality and Innovation<br />
payment framework.<br />
2.6 Statements from the CQC<br />
<strong>Plymouth</strong> <strong>Hospitals</strong> NHS <strong>Trust</strong> is required to register with the Care Quality Commission and<br />
its current registration status is ‘registered’ and therefore licensed to provide services.<br />
<strong>Plymouth</strong> <strong>Hospitals</strong> NHS <strong>Trust</strong> no conditions on its registration.<br />
The Care Quality Commission has however taken enforcement action against <strong>Plymouth</strong><br />
<strong>Hospitals</strong> NHS <strong>Trust</strong>. A Warning Notice was issued on 22 February 2011 for concerns raised<br />
about the number of Never Events in our operating department.<br />
<strong>Plymouth</strong> <strong>Hospitals</strong> NHS <strong>Trust</strong>s has not participated in special reviews or investigations by<br />
the Care Quality Commission as at 31 <strong>March</strong> 2011.<br />
2.7 Data Quality<br />
We recognise that good quality information underpins effective delivery of quality patient care.<br />
Having robust data enable us to make meaningful decisions to improve care and overall<br />
patient safety.<br />
<strong>Plymouth</strong> <strong>Hospitals</strong> NHS <strong>Trust</strong> submitted records during April to December 2010 to the<br />
Secondary Uses service for inclusion in the Hospital Episode Statistics which are included in<br />
the latest published data. The percentage of records in the published data:<br />
Which included the patient’s<br />
valid NHS number was:<br />
Percentage for admitted patient<br />
care<br />
% Which included the patient’s<br />
valid general medical practice<br />
was:<br />
98.3% Percentage for admitted patient<br />
care<br />
%<br />
99.9%<br />
Percentage for outpatient care 98.8% Percentage for out patient care 100%<br />
Percentage for accident and<br />
emergency care<br />
93.3% Percentage for accident and<br />
emergency care<br />
99.5%<br />
2.8 Information Governance<br />
<strong>Plymouth</strong> <strong>Hospitals</strong> NHS <strong>Trust</strong> Information Governance Assessment Report score overall<br />
score for 2010-11 was 71% and was graded as green, which equates to satisfactory using<br />
the IGT Grading Scheme.<br />
2.9 Clinical Coding<br />
<strong>Plymouth</strong> <strong>Hospitals</strong> NHS <strong>Trust</strong> was subject to the Payment by Results clinical coding audit<br />
during 2009/10 by the Audit Commission and the error rates reported in the latest published<br />
audit for that period for diagnoses and treatment coding (clinical coding) were:<br />
Sarah Widnell / Jayne Glynn V7 21.03.11 11
Item 7<br />
Criteria Measured 2009/10 %<br />
Primary diagnoses incorrect 12%<br />
Secondary diagnoses incorrect 9.2%<br />
Primary procedures incorrect 11.7%<br />
Secondary procedures incorrect 5.5%<br />
The <strong>Trust</strong> was not subject to a Payment Results audit in 2010/11 however, <strong>Plymouth</strong><br />
<strong>Hospitals</strong> NHS <strong>Trust</strong> completed an Information Governance Audit completed by D & A<br />
Consultancy in June 2010 and error rates had improved as detailed below :<br />
Criteria Measured 2010/11 %<br />
Primary diagnoses incorrect 2.5%<br />
Secondary diagnoses incorrect 1.25%<br />
Primary procedures incorrect 3.19%<br />
Secondary procedures incorrect 1.25%<br />
Sarah Widnell / Jayne Glynn V7 21.03.11 12
Item 7<br />
Part 3 Review of Services<br />
3.1 How the <strong>Trust</strong> identifies local improvement priorities<br />
A Quality Strategy for Patients for the <strong>Trust</strong> was approved by the <strong>Trust</strong> <strong>Board</strong> in<br />
December 2010. This provides a renewed focus and momentum on addressing current<br />
and future quality improvement challenges and ensures that all staff share the same<br />
understanding of what quality care should look like. It reflects the shared ambitions of<br />
everyone working for the <strong>Trust</strong> to provide high quality person-centred, clinically effective<br />
and safe healthcare services and to be recognised as a leader in our approach.<br />
Our approach to quality is based upon the three aspects of quality set out within the<br />
NHS Next Stage Review 1 led by Lord Darzi, and have been defined as:<br />
provided<br />
patient-<br />
• the effectiveness and access of the treatment and care<br />
to patients – measured by both clinical outcomes and<br />
reported outcomes;<br />
• the safety of the treatment and care provided to<br />
patients; and<br />
• the broader experience patients have of the<br />
treatment and care they receive.<br />
In short, effective, safe and personal are<br />
the three aspects required to deliver a<br />
quality service. Effective care being<br />
the foundation of high quality care,<br />
but it must then be delivered<br />
safely and in a personal way.<br />
Personal Care<br />
“Be nice to me”<br />
Safe Care<br />
“Don’t harm me”<br />
Effective Care<br />
“Treat me right, the first time”<br />
High-level quality ambitions for the <strong>Trust</strong> have been set for each of the quality<br />
dimensions. Improvement priorities will be identified annually working towards achieving<br />
these high level ambitions.<br />
Additionally to inform this process the <strong>Trust</strong> is committed to understanding and<br />
responding to the views of patients, staff and the public in determining priorities for<br />
quality.<br />
Consultation with staff, patients and members of the public have taken place during<br />
2010 to determine priority areas. This has led to the development of four patient<br />
promises. These promises will shape the business strategy and objectives and are an<br />
ongoing commitment to the <strong>Trust</strong>’s patients. These are the promises that every member<br />
of staff makes to patients:<br />
I will……<br />
I will …...<br />
I will …..<br />
I will …..<br />
care for you compassionately and respectfully<br />
give you clear information and involve you in your care<br />
give you the best treatment I can when you need it<br />
make sure you are treated in a clean and safe environment<br />
1 Darzi, Lord A. (2009), High Quality Care for All, DOH, London<br />
Sarah Widnell / Jayne Glynn V7 21.03.11 13
Item 7<br />
3.2 Performance against key national priorities<br />
2010-11 has been a successful year in relation to safety, quality and patient experience.<br />
This section describes the <strong>Trust</strong>’s performances against key quality performance targets<br />
as well as progress against quality indicators highlighted as priorities for 2010/11.<br />
(To be updated post 31 <strong>March</strong> 2011)<br />
Target Standard Performance Achieved<br />
Incidence of C-Diff 101 (max) 26 <br />
Incidence of MRSA 8 (max) 3 <br />
18 week maximum wait for admitted 90% 95.9% <br />
patients from point of referral to<br />
treatment<br />
18 week maximum wait for non 95% 97.0% <br />
admitted patients from point of referral<br />
to treatment<br />
Maximum time in ED of four hours from 95% 97.8% <br />
arrival to admission, transfer or<br />
discharge<br />
All cancer two week wait 93% 95.3% <br />
Two week wait for symptomatic breast 93% 97.9% <br />
patients (cancer not initially suspected)<br />
31 day (diagnosis to treatment) wait for 96% 98.1% <br />
first treatment: all cancers<br />
31 day wait for second or subsequent 94% 96.8% <br />
treatment: surgery<br />
31 day wait for second or subsequent 98% 100.0% <br />
treatment: anti cancer drug treatments<br />
31 day wait for second or subsequent 94% 94.3% <br />
treatment: radiotherapy treatments<br />
62 day (urgent GP referral to 85% 86.7% <br />
treatment) wait for first treatment: all<br />
cancers<br />
62 day consultant upgrade wait for first 90% 90.1% <br />
treatment: all cancers<br />
62 day wait for first treatment from 90% 92.1% <br />
consultant screening service referral:<br />
all cancers<br />
Access to genitor-urinary medicine 100% 100.00% <br />
clinics (48 hours)<br />
Access to rapid access chest pain >=98% 100.00% <br />
clinics within two weeks from referral<br />
from GP<br />
Cancelled operations by the hospital
Item 7<br />
3.3 Patient Safety<br />
Keeping patients safe is central to providing high quality care and we have continued our<br />
efforts to do all we can to continuously improve patient safety. <strong>Plymouth</strong> <strong>Hospitals</strong> NHS<br />
<strong>Trust</strong> has adopted key principles of the SHA Patient Safety Improvement Programme,<br />
which commenced in October 2009 and will run for a period of 5 years. The Programme<br />
aims to reduce the hospital standardised mortality rate by 15% and adverse events by<br />
30% by 2014. These aims will be achieved through the implementation of evidence<br />
based initiatives in five core work streams: Leadership; Critical Care; General Ward;<br />
Medicines Management and Peri-Operative. Each work stream has an executive,<br />
clinical and nursing lead.<br />
This is a comprehensive improvement programme striving to deliver safe care for every<br />
patient every time. Reliability and standardisation are central to this work. Progress<br />
within each work stream is continuously measured for improvement purposes and<br />
reported to the SHA monthly. Four of the priorities identified in 2009/10 were aligned to<br />
the Patient Safety Improvement Programme and have delivered consistent results.<br />
Executive Patient Safety Walkround was introduced in 2010 and provides an opportunity<br />
for front line staff to meet and discuss safety issues with directors. Safety briefings and<br />
safety bulletins have also been introduced as a means of spreading good practice,<br />
providing feedback and learning from adverse events across the <strong>Trust</strong> as a whole.<br />
Serious Incidents and Never Events<br />
The <strong>Trust</strong> has a process for managing all incidents and serious incidents, which includes<br />
those classified as ‘Never Events’ by the National Patient Safety Agency. Since 1 April<br />
2010 six Never Events have occurred at <strong>Plymouth</strong> <strong>Hospitals</strong> NHS <strong>Trust</strong> in the following<br />
categories:<br />
• Wrong site nerve block performed in April 2010<br />
• Swab retained in August 2010<br />
• Wrong site surgery performed in August 2010<br />
• Swab retained in November 2010<br />
• Swab retained in December 2010<br />
• Throat pack retained in January 2011<br />
In line with <strong>Trust</strong> policy each incident was investigated to establish the root cause and<br />
immediate actions taken in response to the investigation findings. To address the issues<br />
raised a comprehensive Theatre Patient Safety Strategy has been introduced which<br />
focuses on 10 key domains which are essential to provide permanent improvement in<br />
patient safety:<br />
• Leadership<br />
• Safety culture<br />
• Implementing best practice<br />
• Standardising <strong>Trust</strong> policy<br />
• Implementing standard operating procedures<br />
• Documentation<br />
• Education and training<br />
• Communication with staff<br />
• Communication with patients and families<br />
• External expertise<br />
Sarah Widnell / Jayne Glynn V7 21.03.11 15
Item 7<br />
Target<br />
Performance Performance Target<br />
09/10 10/11 11/12<br />
Incidence of C-diff 77 26 tbc 43<br />
Incidence of MRSA 15 3 tbc 5<br />
Hand hygiene completion rates 100% 100% 100%<br />
Hand hygiene compliance rates 98% tbc 95%<br />
Patient falls resulting in harm or death 89 103 90<br />
Incident reporting rate – per 100<br />
admissions<br />
3.5 3.86<br />
(Sept 10)<br />
4.25<br />
Number of Never events 2 6 0<br />
% of observation charts completed<br />
accurately<br />
60% 89% 95%<br />
Deaths from cardiac arrests 474 255 TBC<br />
Ulcer prevalence (% of patients with<br />
pressure ulcers)<br />
Total Patients:<br />
Hospital Acquired:<br />
% patients receiving appropriate VTE<br />
risk assessment (started recording<br />
from July 2010)<br />
% patients receiving appropriate<br />
thromboprophylaxis<br />
Infection Control<br />
N/A<br />
N/A<br />
5.3%<br />
2.3%<br />
N/A 56%<br />
93% 95%<br />
TBC<br />
The Infection Prevention and Control Team (IPCT) at <strong>Plymouth</strong> <strong>Hospitals</strong> NHS <strong>Trust</strong><br />
has made significant progress towards modernising the service it provides and meeting<br />
the challenging new agenda being set at both local and national levels. This has led to<br />
improvements in clinical practice, with reductions in healthcare-associated infections.<br />
During 2010/11, we reinforced our efforts to control and reduce MRSA and Clostridium<br />
difficile infections. How: consistent approach to three important areas: environmental<br />
cleanliness, appropriate antibiotic prescribing and strict hygiene at the point of care have<br />
all been vigorously pursued.<br />
Key achievements for the year April 2010-<strong>March</strong> 2011 were as follows:<br />
• MRSA bacteraemias – to reduce cases of MRSA bacteraemias in line with the<br />
national target of 9 and local target of 6. For the period April to December 2010<br />
there were 3 cases.<br />
• Clostridium difficile – to reduce cases of post 72 hour clostridium difficile in line<br />
with the national target of 128 and local target of 117. For the period April to<br />
December 2010 there were 24 cases.<br />
Sarah Widnell / Jayne Glynn V7 21.03.11 16
Item 7<br />
• To achieve a 10% reduction in all cases of MRSA. For the period April to<br />
December 2010 there were 31 new cases, compared to 53 in the same period<br />
last year which equates to 42%<br />
• Epidemic gastroenteritis – to maintain the average ward closure time due to<br />
epidemic gastroenteritis below 7 days. For the period April to December 2010<br />
there were 4 ward closures with an average ward closure period of 5.5 days.<br />
• Hand hygiene compliance – for all wards to perform at least 1 monthly hand<br />
hygiene audit with a compliance rate of 95%. For the period April to December<br />
2010 overall compliance was 99%.<br />
• Alcohol hand gel - for the availability of alcohol hand gel in clinical areas to be<br />
maintained as close to 100% as possible. For the period April to December 2010<br />
availability was 98%.<br />
• Surgical site surveillance – to continue surgical site surveillance on all major<br />
procedures. Majority of procedures now covered.<br />
• Delivery of a Postgraduate Certificate in Infection Prevention and Control in<br />
collaboration with the Peninsular School of Medicine and Dentistry. Two module<br />
PGCert to run in spring and summer 2011.<br />
• Infection Control Website developed and updated.<br />
• Saving Lives High Impact Interventions – all wards to perform at least 1 audit for<br />
in use medial devices, compliance monitored through the dashboard.<br />
C. Difficile Reporting<br />
Sarah Widnell / Jayne Glynn V7 21.03.11 17
Item 7<br />
MRSA Reporting<br />
Medicines Management<br />
Patient Information Following Discharge<br />
Pharmacy launched the Patient helpline last year with poster advertising the service put<br />
up in the Outpatient Department and Accident & Emergency Department with business<br />
cards issued with all outpatient and discharge medication. The service and phone<br />
number are also printed on the medication bag labels. In addition all medicines are<br />
dispensed with a patient information leaflet.<br />
At the point of discharge nursing staff will explain the discharge medication with the<br />
patient. For those patients who collect their outpatient medication from Pharmacy, they<br />
will have the opportunity to ask Pharmacists for advice and guidance.<br />
The <strong>Trust</strong> has developed a Self Administration Policy, will be underpinned by better<br />
engagement with patients about their medication, medication reminder cards will be<br />
made available for patients to help improve their understanding. To support the new<br />
service a patient information leaflet has also been designed.<br />
E-discharge has now been rolled out <strong>Trust</strong> wide in the last 12 months with patients being<br />
given a comprehensive list of their medicines on discharge with a copy of the clinical<br />
information. Patients are also given a list of medicines to give to their community<br />
Pharmacy to improve the seamless transfer of care on discharge<br />
3.4 Clinical Effectiveness<br />
Stroke Pathway<br />
The Care Quality Commission (CQC) carried out a review of services, ranking health<br />
trusts and social care services on a number of areas. These included acute care,<br />
discharge from hospital, access to rehabilitation and continuing care and support.<br />
<strong>Plymouth</strong> was ranked as "best performing". <strong>Plymouth</strong> <strong>Hospitals</strong> NHS <strong>Trust</strong> has one of<br />
the lowest mortality ratios following stroke within England and performance against<br />
direct admission to an Acute Stroke Unit is in the upper quartile within the region.<br />
In addition the SHA commended <strong>Plymouth</strong> <strong>Hospitals</strong> NHS <strong>Trust</strong> and NHS <strong>Plymouth</strong> on<br />
the reconfiguration of services that followed a review in 2008. The impression was that<br />
the stroke services are now delivered by a cohesive and joined up team who have<br />
clearly worked hard to develop a high quality stroke service.<br />
Sarah Widnell / Jayne Glynn V7 21.03.11 18
Item 7<br />
TIA Service<br />
This is a good example of joint working for the prevention of stroke as the service is<br />
provided by neurologists, health care of the elderly consultants, acute GP service with<br />
support from other departments providing rapid access diagnostics. This means that<br />
patient only have one visit to hospital and reduces the need for repeated follow up.<br />
Hospital Standardised Mortality Ratio (HSMR)<br />
The hospital standardised mortality ratio continues to fall, which can be attributed to the<br />
attention given to the patient pathway and the introduction of a number of programmes<br />
to improve safety including infection control and ward cleanliness.<br />
The ongoing Patient Safety Improvement Programme which consists of a number of<br />
various elements which focus on delivering improvements in patient safety. The five key<br />
domains of care are:<br />
• Leadership<br />
• General Ward Care<br />
• Perioperative Care<br />
• Critical Care<br />
• Medicines Management<br />
A wide range of <strong>Trust</strong> initiatives contribute to overall improvement of the <strong>Trust</strong>’s HSMR<br />
in conjunction with external guidance available from a variety of sources including NICE<br />
and National Patient Safety Agency.<br />
Target<br />
Performance<br />
09/10<br />
Performance<br />
10/11<br />
Mortality (HMSR)<br />
84.3 Relative 77.3 Relative<br />
Risk*<br />
Risk*<br />
Stroke mortality rate 101.9 95.9 Relative<br />
Relative Risk* Risk*<br />
% stroke patients spending 90% of 46% 68%<br />
their stay on ASU<br />
Target<br />
11/12 (tba)<br />
Fractured NOF – delays to surgery<br />
< 48hrs<br />
52% 24%<br />
Fractured NOF- readmission rates 4.0% 1.4%<br />
Heart failure readmission rates 13.1% 10.7%<br />
Sarah Widnell / Jayne Glynn V7 21.03.11 19
Item 7<br />
Cancelled operations by the hospital<br />
for non-clinical reasons on the day of<br />
or after admission<br />
Cancelled operations by the hospital<br />
for non-clinical reasons on the day of<br />
or after admission, who were not<br />
treated within 28 days<br />
* National Average = 100<br />
1.9% (1100) 1.6% (779)<br />
14.1% (155) 3.5% (27)<br />
Patient Experience<br />
Patient experience is the term used to describe those aspects of healthcare that, though<br />
they do not relate directly to the treatment of illness or injury, can make all the difference<br />
to whether patients feel that they have been looked after properly.<br />
A Patient Experience Strategy for the <strong>Trust</strong> was approved by the <strong>Trust</strong> <strong>Board</strong> in<br />
December 2010. This strategy outlined our plans to develop the patient experience.<br />
During 2010-11 we implemented a programme of local patient experience surveys on<br />
our wards to gather regular feedback from patients. Patients are asked about cleanliness,<br />
quality of food, how they are communicated with and involved, and about how respectful<br />
and kind staff are. A total of 26 inpatient adult wards have been surveyed and 760<br />
patients involved between October and <strong>March</strong> 2011.<br />
As part of this programme real-time feedback is collected at ward level to allow instant<br />
reporting of patient satisfaction scores. All feedback is collated and fed back directly to<br />
the ward management teams to allow action planning and improvement activity to take<br />
place.<br />
In addition to this programme the <strong>Trust</strong> obtains feedback from patients through a variety<br />
of channels: complaints, PALS, local media and websites, national patient and staff<br />
surveys. Key themes from all this activity are drawn together to form a more rounded<br />
views of the patient experience.<br />
A new steering group, the Improving Through Listening Steering Group, has been set up<br />
dedicated to monitoring and driving forward improvement actions, the group meets<br />
regularly and includes a patient representative.<br />
(D/N Will need to be updated once new Peat Scores are released, CQC publishes<br />
standardised National Inpatient Survey results and <strong>March</strong> 31 st local survey<br />
recommended scores)<br />
Target<br />
PEAT Scores Food & Hydration<br />
Environment<br />
Privacy & Dignity<br />
Recommender scores (would definitely<br />
recommend)<br />
Overall satisfaction scores (excellent<br />
and very good)<br />
Performance<br />
09/10<br />
Performance<br />
10/11<br />
Target<br />
11/12<br />
Good Excellent Excellent<br />
Good Good Excellent<br />
Good Good Good<br />
Not available 86% * 88%<br />
84% 79% 84%<br />
Sarah Widnell / Jayne Glynn V7 21.03.11 20
Item 7<br />
Overall Dignity and respect (always) 83% 79% 84%<br />
% patients receiving care in single sex<br />
setting<br />
% patients given a choice of admission<br />
date<br />
% patient rating cleanliness as very or<br />
fairly clean<br />
80% 82% 85%<br />
22% 21% 25%<br />
95% 97% 97%<br />
% involved as much as wanted to be in 57% 54% 57%<br />
decision about their care<br />
% experiencing delayed discharge 53% 56% 57%<br />
from hospital<br />
Complaints and concerns 529 666* 600<br />
Complaints and concerns responded to<br />
within target time<br />
18.9% 39.7%* 100%<br />
* up to February 2011<br />
Satisfied Patients<br />
The majority of our patients feel the care they received is excellent or very good,<br />
according to a survey by the Care Quality Commission taken in the summer of 2010.<br />
Respondents to the National Inpatient Survey reported improvements in a number of<br />
areas when compared with last year’s survey, these were:<br />
• The hospital did not change their admission date<br />
• Less patients shared same sex sleeping areas<br />
• Further cleanliness improvements<br />
• Greater confidence and trust in nursing staff<br />
• More patients feeling involved in decisions their discharge from the<br />
hospital.<br />
Privacy and dignity<br />
Our <strong>Trust</strong> is committed to delivering the highest standards of privacy and dignity for its<br />
patients. We have been striving to create better same-sex accommodation to ensure<br />
that the privacy and dignity of our patients is respected. We are working wherever<br />
clinically possible, to provide men and women with separate sleeping areas, bathrooms<br />
and toilets. This programme of work has included many upgrades, including to our toilets<br />
and washing facilities to give better segregation for men and women.<br />
Patient Promises<br />
During 2010 we have developed four patient promises after consulting with patients and<br />
staff. These promises, described earlier, will be the promises that every member of staff<br />
makes to each and every patient. During 2011-12 these promises will be developed in<br />
detail to ensure that every member of staff is clear about the commitment they are<br />
making to delivering excellent patient care.<br />
Sarah Widnell / Jayne Glynn V7 21.03.11 21
Item 7<br />
Complaints and Compliments<br />
The <strong>Trust</strong> has worked hard on improving its response and learning from feedback from<br />
patients, relatives and carers. Where possible the <strong>Trust</strong> will resolve complaints locally<br />
and recognises that further work is required in this area during 2011/12.<br />
Each inquiry and complaint received by the <strong>Trust</strong> is acknowledged within 48 hours and<br />
an investigated with the objective of replying to the complainant undertaken within 25<br />
working days. Each clinical service which was subject to a complaint is required to<br />
include the improvements they have made or plan to take within the response. The<br />
Patient Services Team collates and monitors trends to identify further opportunities for<br />
improvement.<br />
The <strong>Trust</strong> has established the Improving Through Listening Steering group to consider<br />
all patient related comments and concerns, including surveys, complaints, comments<br />
and compliments. The primary aim of the group is to develop strategies for the ongoing<br />
development of services to patients. One of the priorities for the coming year is to deliver<br />
customer care awareness training to all staff, so that staff can respond effectively to<br />
patient needs at the earliest opportunity.<br />
The Improving Through Listening Steering Group also has responsibility for assessing<br />
how the <strong>Trust</strong> gathers and uses information so that the patient’s voice is heard.<br />
In order to improve existing response rates for complainants, the <strong>Trust</strong> has<br />
commissioned several pieces of work which are expected to deliver results in the first<br />
half of 2011. Work includes better utilisation of IT technologies to distribute<br />
documentation, flexible approach to methods used to expedite resolutions of issues,<br />
simplify the existing arrangements with clinical areas to support the investigation and<br />
earliest possible response.<br />
An example of learning outcomes following a number of complaints, has been a review<br />
of the management of follow up waiting lists and the reduction in the backlog of<br />
neurology clinic letters.<br />
The <strong>Trust</strong> received 39 compliments during the period 2010-11 which are fed back to staff<br />
and used as part of local staff training as examples of good practice and team building.<br />
An extract from one of these compliments is shown below:<br />
“I would like to place on record my grateful thanks to all the staff with whom I came in<br />
contact during my brief stay. From the reception in Fal Ward, the theatre staff, to the<br />
staff in Postbridge Ward during my recovery I was treated throughout with courtesy,<br />
kindness and total professionalism”<br />
“I must commend to you the Audiology and ENT departments at Derriford, who after a<br />
somewhat delayed start of getting into the system (no fault of theirs) dealt with me most<br />
efficiently. My doctor was particularly kind, informative, helpful and reassuring”<br />
3.5 Quality and the Business Strategy<br />
A commitment to quality is at the heart of what we do as an organisation. The <strong>Trust</strong>’s<br />
Quality Strategy outlined the many quality improvement projects currently underway in<br />
the <strong>Trust</strong>. In addition each clinical directorate has as part of their business plan for the<br />
2011-12 financial year completed a quality plan. These quality plans describe each<br />
services quality programme of work with clear targets and performance monitoring.<br />
Sarah Widnell / Jayne Glynn V7 21.03.11 22
Item 7<br />
3.6 Leadership<br />
During 2011-12 we will launch an Organisational Development Programme for all our<br />
staff. The aim of the programme is to help create a culture to ensure that patients are put<br />
at the heart of everything and that staff feel valued, supported, involved, engaged and<br />
empowered.<br />
3.7 Innovation<br />
The <strong>Trust</strong> recognises that in order to improve we must be innovative in our solutions to<br />
solve quality issues. Below are two examples of work that has taken place and<br />
improved the quality of care our patients receive:<br />
Infection Prevention and Control - Surgical Site Infection monitoring<br />
The <strong>Trust</strong>’s infection control team were awarded top prize at the National Patient Safety<br />
Awards 2011, in the Infection Control and Hygiene category. The team won the award<br />
for their surgical site infection surveillance service, which has driven down the incidence<br />
of infections in surgical procedures for which surveillance has been established for some<br />
time, notably cardiac and vascular surgery. This is important for patients for whom an<br />
infection after surgery can delay a good timely recovery.<br />
The service assesses procedure specific surgical site infections on a quarterly basis and<br />
is exceptional because it includes areas outside of the Health Protection Agency range<br />
and performs surveillance post-discharge by undertaking patient questionnaires on all<br />
major surgical procedures. Reports are fed back to individual surgeons and directorates<br />
on a quarterly basis.<br />
Stroke Care<br />
<strong>Plymouth</strong> health and social care was rated as Best Performing for stroke because, out of<br />
15 indicators measured, the area scored amongst the best in the country by the Care<br />
Quality Commission,<br />
Consideration was given to the care experienced by people who have had a stroke and<br />
their carers. It starts from the point people prepare to leave hospital, to the long-term<br />
care and support that people may need to cope with stroke-related disabilities. It looks at<br />
both health and adult social care, as well as links to other relevant services, such as<br />
local support groups and services to help people participate in community life.<br />
Health organisations, <strong>Plymouth</strong> <strong>Hospitals</strong> NHS <strong>Trust</strong> and NHS <strong>Plymouth</strong>, and <strong>Plymouth</strong><br />
City Council have focused considerable effort on improving care for stroke patients in the<br />
last two years and this is demonstrated in the rating given to the area.<br />
<strong>Plymouth</strong> scored very well in terms of the outcomes for patients one year after their<br />
stroke and had one of the lowest mortality ratio of all areas in the country. Measures<br />
taken within Derriford Hospital to help achieve this include setting up direct admission for<br />
patients to a dedicated stroke unit where they are cared for by a specialist team of<br />
doctors, nurses, physiotherapists, speech and language and occupational therapists.<br />
Direct access to a TIA clinic – any patient who has had a mini or warning stroke (a TIA)<br />
can be referred in and seen within 24 hours if they are high-risk and seven days if not<br />
assessed as high risk and access to thrombolysis (clot-busting drugs) for all eligible<br />
patients whose stroke is caused by a clot rather than a bleed, is now available 24 hours<br />
seven days per week.<br />
Sarah Widnell / Jayne Glynn V7 21.03.11 23
Item 7<br />
3.8 Our Environment<br />
Providing patients with modern, accessible and well designed facilities is important to the<br />
<strong>Trust</strong>. We will continue to refurbish and improve our hospital building where appropriate.<br />
During 2010-11 we have installed a series of images and artwork around the building to<br />
improve healthcare environments across the <strong>Trust</strong>.<br />
Zest, based in the Estates Department, work on the design of new and refurbished<br />
healthcare buildings as well as projects within the day to day provision of healthcare.<br />
The aim with all of their work is to transform the healthcare experience, at key moments<br />
in people's lives, into a positive one. Nearly nine out of ten people say that better quality<br />
buildings and public spaces improve their quality of life, according to MORI research<br />
published by the Commission for Architecture and the Built Environment (CABE)<br />
September 2009. Good healthcare environments have been found to lead to:<br />
• faster patient recoveries<br />
• reduced pain<br />
• fewer cases of infection<br />
• greater patient satisfaction<br />
• reduced stress levels among staff<br />
• easier recruitment and retention of quality staff<br />
One example of Zest’s work in 2010 was a project where the team worked with<br />
designers Neil Tinson and Chris Haughton to create bright and colourful images that are<br />
now installed in both the main and pharmacy stairwells at Derriford Hospital, an example<br />
is shown below. They were commissioned to help make the stairwells more attractive<br />
and encourage, patients, staff and visitors to use the stairs more frequently.<br />
Stairwell between level 3 and 4<br />
3.9 Partner Organisations<br />
The <strong>Trust</strong> is committed to working with its partner organisations to meet the continuing<br />
care needs of patients in an efficient and effective way, across the whole patient<br />
pathway. The <strong>Plymouth</strong> Health Community has a Health and Social Care Improvement<br />
Plan (2010/11 to 2013/14) which outlines how <strong>Plymouth</strong>’s Health and Social Care<br />
organisations are increasingly working together to plan services and service changes;<br />
Sarah Widnell / Jayne Glynn V7 21.03.11 24
Item 7<br />
deliver them together where this adds value and identify areas where expertise,<br />
functions and facilities could be shared or aligned.<br />
There is regular contact between the <strong>Trust</strong> and its main Health and Adult Social Care<br />
Overview and Scrutiny panel at <strong>Plymouth</strong> City Council. In 2010/11 the Chief Executive of<br />
the <strong>Trust</strong> continued to hold quarterly meetings with the panel Chair and the <strong>Trust</strong> gave<br />
presentations at six of the panel’s meetings. This regular contact ensured that<br />
information was shared and the panel gave feedback to the <strong>Trust</strong> on issues such as<br />
quality and performance. In the last quarter of 2011, the <strong>Trust</strong> has strengthened relations<br />
with Cornwall Health and Adults Overview and Scrutiny Committee, attending panel<br />
meetings and ensuring the free flow of two-way communication.<br />
In addition the <strong>Trust</strong> works with a huge range of patient and voluntary organisations to<br />
ensure we involve and work with them to understand other people’s views and how we<br />
are doing.<br />
Close working relationships have been forged with <strong>Plymouth</strong> Local Involvement Network<br />
(LINk), established to enable people in <strong>Plymouth</strong> to have their say on their local health<br />
and social care services. The group is run by local people and independently supported<br />
with a primary aim of finding out people’s views about health and social care and<br />
monitoring local services.<br />
Members of <strong>Plymouth</strong> LINk are members of the newly formed Improving Through<br />
Listening Steering Group, which aims to ensure that the views of patients and carers are<br />
actively solicited and used by the <strong>Trust</strong> to make demonstrable improvements to patient<br />
experience. In addition a member of the <strong>Plymouth</strong> LINk sits as a representative on the<br />
public part of the <strong>Trust</strong> <strong>Board</strong>.<br />
<strong>Plymouth</strong> <strong>Hospitals</strong> NHS <strong>Trust</strong> worked in conjunction with <strong>Plymouth</strong> LINk to produce a<br />
survey aimed at establishing how patients leaving the hospital have found the<br />
experience of hospital discharge. Throughout January and February 2011 all inpatients<br />
were given a LINk Discharge Survey at the point of discharge with the aim of gathering<br />
views on the patients experience to ultimately improve the process.<br />
Annex 1: Statement from Key Stakeholders<br />
We have invited comments from our key stakeholders. These are outlined below<br />
Sarah Widnell / Jayne Glynn V7 21.03.11 25
Item 8<br />
SUMMARY REPORT<br />
<strong>Trust</strong> <strong>Board</strong> (Part 1) 25 <strong>March</strong> 2011<br />
Subject<br />
Prepared by<br />
Approved by<br />
Presented by<br />
Standards for Patients with Dementia<br />
Associate Director of Nursing / Nurse Consultant Older People<br />
Chief Nurse<br />
Chief Nurse<br />
Purpose<br />
The purpose of this report is to inform the <strong>Board</strong> on the requirement to<br />
undertake and report to its commissioners, a self assessment against the<br />
South West Standards for People with Dementia in General <strong>Hospitals</strong> and to<br />
publish this by the end of <strong>March</strong> 2011.<br />
Corporate Objectives<br />
Decision<br />
Approval<br />
Information<br />
Other<br />
Safety Quality Efficiency Workforce Health Governance<br />
• • •<br />
Executive Summary<br />
The self-assessment against the standards has begun – with the formation of a multi-agency<br />
working group, including stakeholders and carers. The initial self-assessment has been<br />
reported to the Safety & Quality Committee and is being developed further. An improvement<br />
plan will be finalised by June 2011.<br />
Key Recommendations<br />
The <strong>Board</strong> is asked to note the standards and the plan to publish a self-assessment by 31<br />
<strong>March</strong> 2011.<br />
Assurance Framework<br />
This pertains to the care of vulnerable patients and takes into account existing national and<br />
local expectations, performance measures and standards – including the National Dementia<br />
Strategy, NICE NICE Quality standards, CQC Essential Standards for Quality & Safety;<br />
National Audit of Dementia in <strong>Hospitals</strong> and South West SHA performance framework for<br />
delivery of the National Dementia Strategy.<br />
Next Steps<br />
The self-assessment will be published by 31 <strong>March</strong> 2011. The development and<br />
implementation of an improvement plan will be monitored by the Safety & Quality Committee.<br />
•<br />
CQC Regulations<br />
Financial Implications<br />
Legal Implications<br />
Equality & Diversity<br />
Corporate Impact Assessment<br />
Regulation 9 (care and welfare of service users) and<br />
Regulation 10 ( assessing and monitoring the quality of service provision)<br />
Failure to meet national and local recommendations could lead to reduced<br />
commissioning of services for patients with dementia.<br />
This work informs part of the <strong>Trust</strong>’s ongoing registration with the CQC<br />
essential standards.<br />
Access to services for patients with dementia.<br />
1
Item 8<br />
DETAILED REPORT<br />
<strong>Trust</strong> <strong>Board</strong> (Part 1) 25 <strong>March</strong> 2011<br />
Subject<br />
Prepared by<br />
Approved by<br />
Presented by<br />
Standards for Patients with Dementia<br />
Associate Director of Nursing/Nurse Consultant Older People<br />
Chief Nurse<br />
Chief Nurse<br />
Purpose<br />
The purpose of this report is to inform the <strong>Board</strong> on the requirement to undertake and report to<br />
its commissioners, a self assessment against the South West Standards for People with<br />
Dementia in General <strong>Hospitals</strong> and to publish this by the end of <strong>March</strong> 2011.<br />
Background<br />
The <strong>Trust</strong> is required to undertake and report to its commissioners, a self assessment against<br />
the South West Standards for People with Dementia in General <strong>Hospitals</strong> (Annex 1). This<br />
assessment should be published by the end of <strong>March</strong> 2011, with an improvement plan<br />
approved by end of June 2011. A peer review process to monitor progress against the<br />
standards across general hospitals in the South West will commence in September 2011.<br />
The self-assessment against the standards has begun – with the formation of a multi-agency<br />
working group, including stakeholders and carers. The initial self-assessment has been<br />
reported to the Safety & Quality Committee and is being developed further. An improvement<br />
plan will be finalised by June 2011.<br />
It is important to ensure that work towards improving standards of care for patients with<br />
Dementia in hospital, links with other work towards the quality agenda and improving patient<br />
experiences such as Essences of Care, Delivering Excellence and High Impact Actions. An<br />
important element of improving standards for patients with Dementia in hospital will be the<br />
awareness and training of all staff.<br />
People with Dementia will access services in the majority of <strong>Trust</strong> specialities - they are<br />
admitted to hospital with a wide range of clinical issues and will access services both<br />
electively and through urgent care pathways. The South West Dementia Partnership<br />
Standards for Patients with Dementia in General hospitals, aim to incrementally improve all<br />
aspects of care for patients with dementia. The standards will be used to:<br />
• benchmark hospital services;<br />
• identify gaps in services; and<br />
• drive improvements in care, facilities and services for people with dementia.<br />
The standards take account of existing national and local expectations, performance<br />
measures and standards – such as the National Dementia Strategy, NICE Quality standards,<br />
CQC Essential Standards for Quality & Safety; National Audit of Dementia in hospitals, South<br />
West SHA performance framework for delivery of the National Dementia Strategy.<br />
Recent reports and research have highlighted the shortcomings in the current provision of<br />
dementia services in the UK. Dementia presents a huge challenge to society, both now and<br />
increasingly in the future. There are currently 700,000 people in the UK with dementia; up to<br />
70% of acute hospital beds are currently occupied by older people and up to a half of these<br />
may be people with cognitive impairment, including those with dementia and delirium.<br />
2
Item 8<br />
Dementia costs the UK economy £17 billion a year and, in the next 30 years, the number of<br />
people with dementia in the UK will double to 1.4 million, with the costs trebling to over £50<br />
billion. General hospitals are particularly challenging environments for people with memory<br />
and communication problems, with cluttered ward layouts, poor signage and other hazards.<br />
People with dementia in general hospitals have worse outcomes in terms of length of stay,<br />
mortality and institutionalisation. This results in an estimated cost of care to patients with<br />
dementia to be more than £6 million per year in an average general hospital.<br />
The National Dementia Strategy (2010) has identified improvements to the care of people with<br />
dementia in general hospitals as one of its key objectives. General hospitals need to have the<br />
following in place:<br />
• An identified senior clinician to take the lead for quality improvement in dementia care in<br />
the hospital;<br />
• An explicit care pathway for the management and care of people with dementia in hospital;<br />
• Specialist liaison older people’s mental health teams to work in general hospitals.<br />
The South West Dementia Partnership has used the National Dementia Strategy, NICE<br />
guidelines (2010) and recommendations from the Alzheimers’ society, to define specific<br />
standards of care for people with Dementia in general hospitals to improve care of people with<br />
Dementia in hospital, reduce delays in discharge and vastly improve patient experiences.<br />
Monitoring<br />
The <strong>Trust</strong> will continue its monitoring of progress towards the Standards for People with<br />
Dementia in General <strong>Hospitals</strong>, through the multi-agency working group. An Improvement<br />
Plan will be developed to be published by June 2011 – this will be reviewed by the Safety &<br />
Quality Committee on a quarterly basis.<br />
Recommendation<br />
The <strong>Board</strong> is asked to note the standards and the plan to publish a self-assessment by 31<br />
<strong>March</strong> 2011.<br />
3
Item 8<br />
South West Dementia Partnership – Summary Standards Annex 1<br />
For each standard listed there are measures or indicators described to inform the monitoring<br />
of the implementation of the standard. Audit processes will be need to be integrated within<br />
hospital governance arrangements to provide evidence of compliance of the standards.<br />
Dementia leads will be required to ensure there is a process for measuring the standards;<br />
achievement and compliance will be reported to the SW Dementia Partnership and the<br />
Strategic Health Authority via commissioners.<br />
Feedback from patients, relatives, carers and volunteers as well as staff delivering care will be<br />
vital in ensuring these standards are being delivered. A process of peer review across the<br />
South West will be implemented in Autumn 2011/12.<br />
Standard 1: People with a dementia are assured respect, dignity and appropriate care<br />
• A Ward Champion for dementia is appointed to provide leadership for delivery and<br />
monitoring (where applicable), as well as training.<br />
• There is accessible literature on the ward for patients, carers and staff.<br />
• The care plan is person-centred for each patient.<br />
• There is individualised and appropriate risk assessment.<br />
• Patient care is person centred, informed by Dementia Care Mapping or similar.<br />
• The trust <strong>Board</strong> regularly reviews serious and untoward incidents, falls, delayed<br />
discharges, and complaints associated with patients with dementia.<br />
Standard 2: Agreed assessment, admission and discharge processes are in place, with<br />
care plans specific to meet the individual needs of people with a dementia and their<br />
carer<br />
• The lead carer is identified and provided with information about how they can support<br />
the patient.<br />
• A booklet ‘This is me’ about each patient is completed to inform care plans.<br />
• All patients with suspected dementia receive a comprehensive assessment with further<br />
referral to memory service if required.<br />
• Carers receive information about the assessment.<br />
• Carers understand that an assessment of their needs can be arranged.<br />
• There is a system so that all staff are aware of the patients with dementia.<br />
• Discharge is actively managed from 24 hours of admission.<br />
• Information on discharge /support available on admission.<br />
• There is a named person who takes responsibility for discharge coordination.<br />
• Discharge plans summarise assessment and treatment and support plan.<br />
• There is access to intermediate care.<br />
Standard 3: People with a dementia or suspected cognitive impairment who are<br />
admitted to hospital, and their carers/families have access to a specialist mental health<br />
liaison service<br />
• There is access to a full multi disciplinary, specialist mental health liaison service. The<br />
level of service is based on assessed need.<br />
• Appropriate referrals are made for further assessment.<br />
• Training provided by liaison teams is incorporated into local training strategies.<br />
4
Item 8<br />
Standard 4: The hospital and ward environment is dementia-friendly, minimising the<br />
number of ward and unit moves within the hospital setting and between hospitals<br />
• The hospital Clinical Champion determines appropriate signage and sensory<br />
environments across the hospital and reviews quality of environment during peak<br />
activity so that standards do not slip.<br />
• Patients with a dementia should not be moved between wards (or hospital) unless<br />
required for their care and treatment.<br />
• If a move is necessary it should be at least disruptive time and carers informed and<br />
involved if appropriate.<br />
• ‘This is me’ profile must accompany the patient is moved.<br />
• Daily therapeutic and recreational activities are available where appropriate.<br />
Standard 5: The nutrition and hydration needs of people with a dementia are well met<br />
• All patients have a weight assessment and are assessed via malnutrition screening.<br />
• Patient preferences are recorded in ‘This is me’.<br />
• Protected mealtimes with carers or volunteers actively encouraged to assist.<br />
• Flexibility in provision and timing of food and appropriate utensils / crockery.<br />
• Access to specialist assessment in 12 hours if swallowing difficulties.<br />
Standard 6: The hospital and wards promote the contribution of volunteers to the wellbeing<br />
of people with a dementia in hospital<br />
• There is designated leader within hospital to promote volunteering for people with a<br />
dementia.<br />
• The Ward Champion identifies ways to improve patient experience by greater<br />
involvement of volunteers.<br />
• Support, feedback and training provided to volunteers.<br />
• Regular review of recruitment and retention of volunteers.<br />
Standard 7: The hospital and wards ensure quality of care at the end of life<br />
• GPs are informed of patients identified as approaching end of life.<br />
• Patients who remain in hospital to die are cared for using an integrated care pathway.<br />
• All clinical and support staff receive appropriate training.<br />
Standard 8: Appropriate training and workforce development are in place to promote<br />
and enhance the care of people with dementia in general and community hospitals, and<br />
their carers/families<br />
• All new staff receive mandatory training.<br />
• The hospital has a training and knowledge framework in place which is being<br />
implemented and reviewed.<br />
5
Item 9<br />
SUMMARY REPORT<br />
<strong>Trust</strong> <strong>Board</strong> (Part 1) 25 <strong>March</strong> 2011<br />
Subject<br />
Prepared by<br />
Approved by<br />
Presented by<br />
Chair’s Report of key issues arising from February and <strong>March</strong> Safety &<br />
Quality Committee meetings<br />
Healthcare Governance Manager<br />
Chief Nurse<br />
Chair, Safety & Quality Committee<br />
Purpose<br />
To provide an update on key issues discussed at the Safety & Quality<br />
Committee (formerly known as the Healthcare Governance Committee)<br />
meeting held on 14 February 2011 and the Safety & Quality Committee<br />
meeting on 14 <strong>March</strong> 2011.<br />
Corporate Objectives<br />
Decision<br />
Approval<br />
Information •<br />
Other<br />
Safety Quality Efficiency Workforce Health Governance<br />
• •<br />
Executive Summary<br />
Key issues considered:-<br />
• Care Qulaity Commission inspection visit of theatres<br />
• Theatre Strategy/action plan (incorporating WHO Checklist actions)<br />
• Review and update of Never Events<br />
• Medicines Management<br />
• National Inpatient Survey<br />
• Dementia Strategy Standards<br />
• Safeguarding<br />
Key Recommendations<br />
<strong>Board</strong> Members are asked to consider the contents of the report.<br />
Assurance Framework<br />
The Committee reviewed a number of key areas of governance and associated action plans<br />
to ensure compliance with the Care Quality Commission (CQC) and Strategic Health<br />
Authority requirements, including the Theatre Patient Safety Strategy, actions plans and CQC<br />
compliance reports.<br />
Next Steps<br />
The Committee will meet on a monthly basis and ensure that all actions agreed at the<br />
previous meetings are implemented.<br />
Progress the agreed Safety & Quality Committee Forward Plan.<br />
CQC Regulations<br />
Financial<br />
Implications<br />
Legal Implications<br />
Equality & Diversity<br />
Corporate Impact Assessment<br />
Relevant to all essential standards and outcomes<br />
Potential loss of income if the <strong>Trust</strong> does not have robust<br />
governance processes in place<br />
CQC registration may be affected<br />
Ensure all patients have equal access to treatment<br />
1
Item 9<br />
DETAILED REPORT<br />
<strong>Trust</strong> <strong>Board</strong> (Part 1) 25 <strong>March</strong> 2011<br />
Subject Chair’s Report of key issues arising from February 2011 and <strong>March</strong> 2011<br />
Safety and Quality Committee meetings<br />
Prepared by<br />
Approved by<br />
Presented by<br />
Healthcare Governance Manager<br />
Chief Nurse<br />
Chair, Safety & Quality Committee<br />
Purpose<br />
To provide a report on key issues discussed at Safety & Quality Committee (formerly<br />
Healthcare Governance Committee) meetings held on 14 February 2011 and 21 <strong>March</strong><br />
2011.<br />
Terms of Reference and Forward Plan<br />
Following the review of committee structures, the revised terms of reference and associated<br />
forward plan were considered and updated for approval by the <strong>Board</strong>. It was agreed that the<br />
Committee would be renamed as the Safety & Quality Committee. Further work was<br />
required to consider the sub-committee structure which supports the Safety & Quality<br />
Committee.<br />
14 February 2011<br />
Key issues discussed included:-<br />
Never Events<br />
Update of progress with actions arising from Never Events.<br />
Update of progress with action plan developed following Never Events in theatres (including<br />
WHO checklist).<br />
Medicines Management<br />
The Medicines Management report was received for information and following detailed<br />
discussion, the Committee requested a more detailed paper regarding actions and<br />
assurances be produced for the <strong>March</strong> meeting.<br />
National Inpatient Survey for 2010<br />
The National Inpatient Survey for 2010 was presented; the overall response rate was slightly<br />
down from 58% in 2009 to 54%. Of the 62 indicators, results showed declining performance<br />
in 35 areas, improvement in 19 areas and static for the remaining 8. Further work is planned<br />
to develop the action plan addressing the recommendations raised within the report.<br />
14 <strong>March</strong> 2011<br />
Key issues discussed included:-<br />
Updated Medicines Management Report<br />
The updated report was discussed in detail, and the Committee requested that further work<br />
be undertaken to identify and analyse the outcome data available, against the requirements<br />
of Outcome 9 (Management of Medicines).<br />
Theatre Patient Safety Strategy<br />
A summary of follow up information was received detailing progress with the new theatre<br />
Patient Safety Strategy and action plan which had been put in place to improve overall<br />
theatre safety following from the Never Events. Particular focus was given to the actions<br />
surrounding compliance with the WHO Safer Surgery Checklist.<br />
2
Item 9<br />
Patient safety Initiative<br />
A review of key workstreams and key issues was presented, eg: falls, pressure ulcers and<br />
recognition of the deteriorating patient, with a request that plans be developed to roll-out the<br />
workstreams across the <strong>Trust</strong>.<br />
Dementia Strategy Standards Report,<br />
A paper outlining the <strong>Trust</strong>’s current position against the Dementia Standards and an outline<br />
action plan was discussed.<br />
Safeguarding Report<br />
A Safeguarding Report providing an overview on safeguarding activity for both children and<br />
adults was considered and also demonstrated the work towards compliance of the<br />
safeguarding standards for the CQC Outcome 7 (Safeguarding People who use Services).<br />
Conclusion and recommendations<br />
The <strong>Board</strong> are asked to note the report<br />
3
Item 10<br />
SUMMARY REPORT<br />
<strong>Trust</strong> <strong>Board</strong> (Part 1) 25 <strong>March</strong> 2011<br />
Subject<br />
Prepared by<br />
Approved by<br />
Presented by<br />
Performance Report<br />
Senior Assurance and Performance Manager<br />
Head of Performance and Management Information<br />
Director of Finance / Chief Operating Officer<br />
Purpose<br />
This paper summarises performance across the full range of NHS Performance<br />
Standards for the year to 28 th February 2011.<br />
Corporate Objectives<br />
Decision<br />
Approval<br />
Information<br />
Other<br />
Safety Quality Efficiency Workforce Health Governance<br />
• • • • •<br />
Executive Summary<br />
The <strong>Trust</strong> is reporting a deficit of £3.5m at the end of February 2011. In order to achieve a break<br />
even position for the financial year a surplus of £3.5m needs to be generated in <strong>March</strong>.<br />
Whilst the <strong>Trust</strong> has actions identified to achieve this position there are some assumptions that<br />
will need active management to realise the position.<br />
Operational performance remains above target in the majority of areas and previous areas of<br />
underperformance due to winter pressures, e.g Accident & Emergency waits, have now fully<br />
recovered to levels observed before December 2010.<br />
Action plans are in place at either <strong>Trust</strong>-wide or specialty level for those areas where performance<br />
is below target.<br />
Key Recommendations<br />
N/A<br />
Assurance Framework<br />
Covers Safety, Quality, Efficiency, Health and Workforce objectives in the Assurance Framework.<br />
•<br />
Next Steps<br />
Active management of mitigating actions and emerging pressures required to maintain levels of<br />
performance and achieve breakeven target.<br />
CQC Regulations<br />
Corporate Impact Assessment<br />
Potential impact on all of the core outcomes.<br />
Financial Implications Assessment of the <strong>Trust</strong> breakeven target and year to date position.<br />
Legal Implications<br />
Equality & Diversity<br />
N/A<br />
Performance metrics include some data relating to equality and<br />
diversity.<br />
1
Item 10<br />
Introduction<br />
1. This paper summarises performance across the full range of NHS<br />
Performance Standards for the year to 28 February 2011.<br />
Finance<br />
Purpose<br />
2. The focus of this narrative is to update the <strong>Board</strong> on the financial results<br />
for the first 11 months of the financial year 2010/11, as detailed in the<br />
<strong>Trust</strong> Data Book and on providing an update to the <strong>Board</strong> in securing<br />
the breakeven target.<br />
Key Issues<br />
3. In the original budget the <strong>Trust</strong> planned a deficit of £0.2m at the end of<br />
February 2010, the <strong>Trust</strong> is reporting a deficit of £3.5m, an adverse<br />
variance of £3.3m.<br />
4. Despite the overall position being still off plan by £3.3m there has been<br />
an improvement in month on the income and expenditure of the <strong>Trust</strong> of<br />
£0.3m due to additional contract and non-recurrent income.<br />
5. This year to date position is in line with the <strong>Trust</strong>’s recovery plan that<br />
was agreed with NHS South West.<br />
6. The <strong>Trust</strong> continues to forecast the delivery of a break even position by<br />
the end of the financial year and has plans to recover the £3.5m deficit<br />
in <strong>March</strong>.<br />
7. There are a number of expenditure budget variances that have equal<br />
and opposite income variances in the <strong>Trust</strong>’s performance report.<br />
These variances have been adjusted for in this report to allow focus on<br />
budget pressures not offset by income.<br />
8. The key areas of variance to note are as follows:<br />
Conclusion<br />
Income is £11.1m ahead of plan<br />
Pay is £3.3m over budget to the end of February. The majority of this<br />
relates to overspends against medical and dental budgets.<br />
Non pay expenditure is £2.9m over budget. Of this number £2.4m<br />
relates to under delivery of planned cost improvement programmes with<br />
the residual caused by in year cost pressures and activity variations.<br />
Depreciation and interest charges are £0.6m higher than budgeted.<br />
CIP schemes that have not been identified against the original target<br />
total £7.6m year to date.<br />
The <strong>Board</strong> is asked to note the financial position at the end of February.<br />
2
Item 10<br />
Safety<br />
9. Infection Control<br />
MRSA<br />
Performance for February for hospital apportioned MRSA bacteraemia<br />
was 0 cases against a trajectory of 0. Performance for the year to date<br />
is 3 hospital apportioned cases against a trajectory of 8.<br />
Clostridium Difficile<br />
Performance for February for hospital apportioned Clostridium Difficile<br />
infection was 3 cases against a trajectory of 14. Performance for the<br />
year to date is 29 hospital apportioned cases against a trajectory of 115.<br />
10. Accident and Emergency 4 Hour Standard<br />
Monthly performance against the national Accident and Emergency 4<br />
hour wait target (95%) improved to 96.3% in February. With the<br />
inclusion of community based Minor Injury Units (MIUs) monthly<br />
performance remained above target at 97.7%.<br />
This improvement represents a recovery above target from the<br />
significant performance drop in December. Year-to-date performance for<br />
the <strong>Trust</strong> remains above the 95% national target at 96.80% (97.98%<br />
including community MIUs).<br />
11. Hospital Standardised Mortality Rates<br />
Quality<br />
The Hospital Standardised Mortality Rate (HSMR) is a statistical<br />
calculation that measures the overall rate of deaths within a hospital,<br />
compared with a national benchmark. Each hospital’s HSMR should be<br />
compared with ‘100’, representing the expected level given the types of<br />
cases treated. A hospital with a rate below 100 had fewer deaths than<br />
would be expected; conversely a rate above 100 will have had more<br />
deaths than would be expected.<br />
The HSMR for <strong>Plymouth</strong> <strong>Hospitals</strong> NHS <strong>Trust</strong> is 77.2 for the 12 months<br />
to January 2010; a mortality rate almost 23% lower (better) than<br />
expected.<br />
12. Referral to Treatment<br />
Although this standard has been removed from the revised NHS<br />
Operating Framework it is still reported and monitored for contractual<br />
reasons.<br />
During February 92.1% of patients treated on an admitted care pathway<br />
were treated within 18 weeks of referral, significantly better than the<br />
3
Item 10<br />
national target of 90%. The aggregated performance for non-admitted<br />
pathways at 97.9% was also above the national target of 95%.<br />
Target rates were achieved in all reportable specialties with the<br />
exceptions of:<br />
• General Surgery admitted<br />
• Urology admitted<br />
• Plastic Surgery admitted<br />
• Dermatology admitted<br />
• Gynaecology admitted<br />
• Neurosurgery non-admitted<br />
• Geriatric Medicine non-admitted<br />
• Neurology non-admitted<br />
During February the decrease in the RTT Admitted backlog has<br />
continued. (December 2010 = 715, January 2011 = 665, February 2011<br />
= 580). This was a planned event and explains the drop in admitted<br />
performance since December 2010 and, more specifically, why five key<br />
surgical specialties failed to achieve 90% in February.<br />
Neurology & Neurosurgery failed to achieve 95% for non-admitted due<br />
to capacity issues in Outpatients and Geriatric Medicine also failed as<br />
there were two breaches out of 21 patients both of which were due to<br />
administrative errors.<br />
From 1 April 2011, we are no longer required to monitor against the 90%<br />
and 95% standards but will move to measuring against median waits,<br />
maximum waits and 95 th percentile thresholds.<br />
13. Reperfusion Waiting Times<br />
The <strong>Trust</strong> has moved to the primary percutaneous coronary intervention<br />
(pPCI) as its preferred first treatment for patients suffering heart attack,<br />
although in certain circumstances thrombolysis may still be administered<br />
when clinical judgement deems this appropriate.<br />
In-month performance against the new pPCI standard improved in<br />
February to 92% which sees our year to date performance at 82%,<br />
which is above the target level (75%). This standard is susceptible to<br />
fluctuations in month on month performance due to the small number of<br />
patients involved.<br />
14. Existing Cancer Standards<br />
The performance against all existing cancer standards is above the<br />
required target for both in month and year to date performance.<br />
4
Item 10<br />
15. Going Further on Cancer Waits (GFOCW) Standards<br />
The performance against all GFOCW standards is above the required<br />
target for both in month and year to date performance with the following<br />
exception:-<br />
• In-month performance 62 Day from screening referral to first<br />
treatment (87.9% in February vs 90% target).<br />
The associated breaches within this standard were due to patient<br />
choice. Hence, the shortfall in February’s performance was attributable<br />
to factors outside of the <strong>Trust</strong>’s control.<br />
16. Diagnostic Waits<br />
There were 80 patients waiting over six weeks for a diagnostic test as at<br />
the 28 February 2011, of which 71 fell within the Endoscopy<br />
Department. This is an improvement on the January position when 180<br />
were waiting for an Endoscopy.<br />
The main reason for the drop in performance seen in Endoscopy is due<br />
to the unexpected loss of two key operators resulting in significant<br />
capacity reduction. Plans are now in place to cover this shortfall going<br />
forward.<br />
In addition, there are 146 patients waiting six weeks longer than their<br />
planned date for a Surveillance Endoscopy. Please note that, of the<br />
146, only five were waiting over 13 weeks. The progress made on<br />
reducing waits in this area has been hampered by the loss of capacity<br />
described above.<br />
17. Cancelled Operations<br />
The proportion of patients cancelled on the day of surgery represented<br />
1.5% of elective admissions (69 patients) during February, above the<br />
Care Quality Commission target of 0.8%.<br />
Of the 69 cancellations, 25 were due to theatre list overruns or<br />
emergencies taking priority and 24 were a result of sick or unavailable<br />
surgeons.<br />
During February there were three patients with a cancelled operation<br />
whose operations had been cancelled previously. These patients fell<br />
within the following specialties:-<br />
• Neurosurgery<br />
• Orthopaedics<br />
• Cardiology<br />
5
Item 10<br />
Health<br />
There were no breaches of the 28 day standard for re-booking<br />
previously cancelled patients during February.<br />
18. GUM Clinics/Breast Feeding/Smoking<br />
Workforce<br />
Performance for all indicators remains constant and within tolerance,<br />
with no significant concerns to report.<br />
19. Run Rate/Workforce numbers<br />
The current monthly pay bill run rate has decreased by £354k since<br />
October 2010 with a decrease in the last month to £19,513k in year to<br />
date. Over the same period, the discretionary pay bill run rate has<br />
reduced by £280k per month to £968k per month representing a 22%<br />
reduction in run rate.<br />
20. Staff in Post and Vacancies<br />
The current <strong>Trust</strong> budgeted establishment has remained relatively static<br />
for the last month at 5,877 FTE. Staff in post has reduced by<br />
approximately 12 FTE to 5,391 over the same period. This differential<br />
reduction between establishment and staff in post has had the effect of<br />
increasing the <strong>Trust</strong>’s budgeted vacancies over the same period to 485<br />
FTE.<br />
21. Mandatory/Essential Skills training<br />
The completion of Mandatory Training and Essential Skills has<br />
decreased slightly in February and now stands at 81% completed taking<br />
into account future booked courses and long term absence. This is<br />
principally due to the historic training year and the traditional distribution<br />
of training throughout the final quarter. <strong>Trust</strong>-wide, no training area<br />
currently sits below 79%. This figure changes weekly as staff complete<br />
training, therefore the future booked figure indicates this dynamic.<br />
22. Appraisal<br />
Appraisal completion rates (for non-medical staff) has continued to<br />
increase and stands at 76.93% in February 2011.<br />
23. Sickness Absence<br />
Sickness absence has continued to decrease during February to 3.91%.<br />
The number of staff with Bradford Scores of more than 300 has<br />
continued to reduce month on month, standing at 705 in February 2011,<br />
in comparison to 930 in <strong>March</strong> 2010.<br />
6
Item 10<br />
The <strong>Trust</strong>’s 12 month average sickness rate stands at 4.45%. The <strong>Trust</strong><br />
has set a trajectory to aim for a target of 3.25% by <strong>March</strong> 2011.<br />
The <strong>Trust</strong> is about to review the Sickness Absence Policy and approach<br />
to managing attendance, and Occupational Health will support the<br />
reduction in sickness absence rates.<br />
Conclusion<br />
The <strong>Board</strong> is asked to note the contents of this report.<br />
7
Item 10<br />
Performance Dashboard<br />
Feb-11<br />
Current<br />
Month<br />
Year to<br />
Date<br />
(where<br />
applicable)<br />
Standard<br />
Safety<br />
Incidence of Clostridium Difficile 115 3 29<br />
Incidence of MRSA 8 0 3<br />
Total Time in A&E 95% 96.3% 96.8%<br />
See<br />
below ^ 5.5% 3.3%<br />
Delayed Transfers of Care<br />
Quality<br />
18 week referral to treatment Admitted 90% 92.1% N/A<br />
Nonadmitted<br />
95% 97.9% N/A<br />
All cancers: one month diagnosis to treatment 96% 98.2% 98.2%<br />
All cancers: two month urgent referral to treatment 85% 86.2% 86.7%<br />
All cancers: two week wait 93% 95.6% 95.3%<br />
62 day wait for first treatment from consultant screening service<br />
referral 90% 87.9% 91.6%<br />
31 day wait for second or subsequent treatment: anti cancer<br />
drug treatment 98% 100.0% 100.0%<br />
31 day wait for second or subsequent treatment: surgery 94% 100% 97.0%<br />
31 day wait for second or subsequent treatment: radiotherapy<br />
treatments 94%^ 98.6% 96.1%<br />
Two week wait for symptomatic breast patients 93%^ 97.1% 97.9%<br />
Rapid Access Chest Pain Service 98% 100% 100%<br />
Patients with stroke spend at least 90% of time on stroke unit** 80%^ 70% 68%<br />
Cancelled Operations on Day of Operation 0.8% 1.5% 1.6%<br />
Those cancelled not admitted within 28 days 5% 0.0% 3.2%<br />
Time to reperfusion for patients who have had a heart attack 75% 92% 82%<br />
Health<br />
Data quality on ethnic group 85% 100% 100%<br />
Access to GUM 100% 100% 100%<br />
Breast Feeding Initiation<br />
Smoking During Pregnancy<br />
** This is a <strong>March</strong> 2011 target<br />
^ The standards or thresholds for these areas have not been set<br />
nationally<br />
Achieving<br />
Under-achieving<br />
Failing<br />
See<br />
below ^ 76% 69%<br />
See<br />
below ^ 18% 17%<br />
8
Item 11<br />
SUMMARY REPORT<br />
<strong>Trust</strong> <strong>Board</strong> (Part 1) 25 <strong>March</strong> 2011<br />
Subject<br />
Prepared by<br />
Approved by<br />
Presented by<br />
Chairman’s Report and key issues arising from the <strong>March</strong> Finance,<br />
Performance & Investment Committee meeting<br />
NED Committee Chairman, Ian Douglas<br />
NED Committee Chairman, Ian Douglas<br />
NED Committee Chairman, Ian Douglas<br />
Purpose<br />
To provide an update on key issues discussed at the Finance, Performance &<br />
Investment Committee meeting held on 16 <strong>March</strong> 2011.<br />
Corporate Objectives<br />
Decision<br />
Approval<br />
Information<br />
Other<br />
Safety Quality Efficiency Workforce Health Governance<br />
•<br />
Executive Summary<br />
Key issues considered by Finance, Performance & Investment Committee included:<br />
• Stock update<br />
• Monthly Performance<br />
• 2011/2012 Budget<br />
• Capital Programme<br />
• Cash Management<br />
• Asset Valuation from District Valuation Officer<br />
• Assurance Framework<br />
•<br />
Key Recommendations<br />
<strong>Board</strong> Members are asked to consider the contents of the report.<br />
Assurance Framework<br />
This update refers to assurances relating to section E1 of the Assurance Framework (achieve the<br />
<strong>Trust</strong>’s planned financial position).<br />
Next Steps<br />
The Committee will continue to address its Forward Work Plan and to report progress to the <strong>Trust</strong><br />
<strong>Board</strong>.<br />
Corporate Impact Assessment<br />
CQC Regulations None<br />
Financial Implications Assessment of year end position and 2011/2012 Budget<br />
Legal Implications None<br />
Equality & Diversity None<br />
1
Item 11<br />
DETAILED REPORT<br />
<strong>Trust</strong> <strong>Board</strong> (Part 1) 25 <strong>March</strong> 2011<br />
Subject<br />
Prepared by<br />
Approved by<br />
Presented by<br />
Chairman’s Report and key issues arising from the <strong>March</strong> Finance,<br />
Performance & Investment Committee meeting<br />
NED Committee Chairman, Ian Douglas<br />
NED Committee Chairman, Ian Douglas<br />
NED Committee Chairman, Ian Douglas<br />
Purpose<br />
To provide an update on key issues discussed at the Finance, Performance & Investment<br />
Committee meeting held on 16 <strong>March</strong> 2011.<br />
1. Stock Update<br />
This was a positive paper, welcomed by the Committee. The Head of Procurement<br />
forecasted a potential annual saving of c£2.2m due to standardisation, reduced stock levels<br />
and reduced obsolescence. The Head of Procurement was tasked with a longer-term project<br />
(end 2011/12) to introduce Vendor Managed Inventory and inventory pull processes across<br />
the <strong>Trust</strong>.<br />
2. Monthly Performance<br />
The month 11 figures (February 2011) showed a reduced deficit of c£3.5m. This was better<br />
than plan, but it was confirmed that month 12 would see a number of pressures on the<br />
financial position. The Director of Financial Services gave strong assurance that the <strong>Trust</strong><br />
would achieve its year-end breakeven position.<br />
The Medical Director and the Finance Director would present the year’s results to the<br />
Hospital Medical Staff Committee, with focus on the areas of non-delivery of Cost<br />
Improvement Plans.<br />
Discussions to mitigate Delayed Transfers of Care were onging with health community<br />
colleagues.<br />
3. 2011/12 Budget<br />
The Committee discussed the draft 2011/2012 budget and projected outturn and noted the<br />
requirement for adequate contingency planning for unforeseen events.<br />
The Committee discussed ‘re-admission’ penalties and were concerned by the lack of clarity<br />
of the definition, which appeared to suggest that the <strong>Trust</strong> would be penalised for most readmissions<br />
regardless of whether they were related to the original procedure or not. The<br />
Director of Financial Services would liaise with health community colleagues and other<br />
relevant bodies to agree a sensible approach to this.<br />
It was confirmed that agreed budgets would be written into departmental and individual<br />
objectives for 2011/12.<br />
The Committee asked the Director of Financial Services for a monthly statement of reserves<br />
and releases.<br />
2
Item 11<br />
The Director of Financial Services and the Chief Operating Officer reassured the Committee<br />
that the additional Bank Holiday on 29 April 2011 would be covered without recourse to<br />
bank/agency staff and additional, non-budgeted costs.<br />
The Committee received strong assurance that the budgeting system for this year was<br />
comprehensive and robust.<br />
4. Capital Programme<br />
The Committee received an update on the capital programme.<br />
5. Cash Management<br />
The Committee received a much improved presentation. The Director of Financial Services<br />
confirmed that the year-end forecast of £140k surplus cash remained accurate and the<br />
revised External Financing Limit had been agreed with NHS South West.<br />
6. District Valuation Officer<br />
The Director of Financial Services tabled a report on the discussion with the District<br />
Valuation Officer (DV). The Committee requested that a dialogue be undertaken with the DV<br />
so that consistent budgeting for depreciation and <strong>Public</strong> Dividend Capital payments could be<br />
effected.<br />
7. Assurance Framework<br />
The Committee reviewed the Efficiency section of the Assurance Framework and agreed<br />
revised risk scores.<br />
Recommendations<br />
1 The <strong>Board</strong> are asked to discuss this report and to note the assurances provided.<br />
3
Item 12<br />
SUMMARY REPORT<br />
<strong>Trust</strong> <strong>Board</strong> (Part 1) 25 <strong>March</strong> 2011<br />
Subject<br />
Prepared by<br />
Approved by<br />
Presented by<br />
2010 Staff Survey<br />
Associate Director of Organisational Development<br />
Chief Executive Officer/Interim Director of Workforce<br />
Interim Director of Workforce<br />
Purpose<br />
This report is a summary of the findings from this <strong>Trust</strong>’s staff survey data<br />
from the National Staff Survey full data. The report highlights key findings<br />
and makes recommendations for future action.<br />
Corporate Objectives<br />
Decision<br />
Approval<br />
Information<br />
Other<br />
Safety Quality Efficiency Workforce Health Governance<br />
• •<br />
Executive Summary<br />
The data provided by the National Staff Survey provides an insight into they way staff feel<br />
about their work at <strong>Plymouth</strong> <strong>Hospitals</strong> NHS <strong>Trust</strong>. The data for 2010 repeats some of the key<br />
improvement messages seen in 2009. Positive findings include:<br />
• Staff report high levels of appraisal and personal development plans being in place, for<br />
which the <strong>Trust</strong> is in the top 20% nationally.<br />
• There is evidence of increased confidence in relation to governance with staff recording<br />
improvements in areas such as feedback following the reporting of incidents.<br />
• Questions relating to how well staff feel communicated with show a small improvement.<br />
Overall, however, significant and important messages from staff indicate that there are key<br />
issues relating to how they are led and how motivated they feel at work. Capturing this and<br />
improving it will impact positively on the success and productivity of the <strong>Trust</strong>.<br />
This is recognised and is being addressed by the <strong>Trust</strong>, which has placed the “people<br />
agenda” and particularly the issue of leadership, at the heart of its strategic plans going<br />
forward.<br />
The <strong>Trust</strong> <strong>Board</strong> is in the final stages of agreeing and endorsing an Organisational<br />
Development programme. Organisational Development focuses on improving the culture of<br />
the organisation to develop a workforce which feels valued, supported, involved, engaged<br />
and empowered, leading to higher productivity and release of greater discretionary effort.<br />
This Organisational Development programme supports and indeed is embedded in the<br />
interim <strong>Trust</strong> Strategy, which has leadership at all levels as one of its three core parts.<br />
The <strong>Trust</strong> finds itself at a crossroads and recognises the need to do things differently, with a<br />
different focus, and to use the staff survey data as a tool to learn from. The Organisational<br />
Development programme and the essential leadership development component of that plan<br />
is the key that will deliver a demonstrable change.<br />
•<br />
1
Item 12<br />
Key Recommendations<br />
1. Continue to support the development and implementation of the Organisational Development<br />
programme.<br />
2. Give priority to the leadership component of the <strong>Trust</strong> Interim Strategy.<br />
3. Ensure that “organisational health” measures around engagement, leadership, development<br />
and well-being are reported alongside other <strong>Trust</strong> performance metrics.<br />
Assurance Framework<br />
The report identifies the risks associated with achieving the <strong>Trust</strong>’s workforce objectives and<br />
seeks to provide assurance that appropriate action will be taken to address these risks.<br />
Next Steps<br />
The OD programme will be developed and agreed by the <strong>Trust</strong> <strong>Board</strong>.<br />
Corporate Impact Assessment<br />
CQC Regulations Outcomes 9,12,13,14<br />
Financial Implications None.<br />
Legal Implications None.<br />
Equality & Diversity The survey gives the <strong>Trust</strong> feedback on equality and diversity.<br />
2
Item 12<br />
DETAILED REPORT<br />
<strong>Trust</strong> <strong>Board</strong> (Part 1) 25 <strong>March</strong> 2011<br />
Subject<br />
Prepared by<br />
Approved by<br />
Presented by<br />
2010 Staff Survey<br />
Associate Director of Organisational Development<br />
Chief Executive<br />
Interim Director of Workforce<br />
Purpose<br />
This report is a summary of the findings from this <strong>Trust</strong>’s staff survey data from the National<br />
Staff Survey full data. More information is available at the Care Quality Commission’s<br />
website. The report highlights key findings and makes recommendations for future action.<br />
Background<br />
The National Staff Survey results for the <strong>Trust</strong> in 2010 mirror the challenging environment<br />
within which the NHS as a whole finds itself. Although there is evidence of improvement (in<br />
all Key Findings the <strong>Trust</strong>’s performance has either improved or remained the same as last<br />
year), overall the results indicates more there is more work to be done to improve the<br />
experience of the <strong>Trust</strong> as a place to work.<br />
Nationally, the most significant change reported in the 2010 staff survey is in respect of<br />
appraisals, which have increased substantially in volume across the NHS. This <strong>Trust</strong> is in<br />
the top 20% of <strong>Trust</strong>s for the number of staff being appraised and for having a personal<br />
development plan in place, which reflects the hard work taking place across the directorates<br />
to ensure staff have the opportunity of an annual appraisal.<br />
Encouragingly, more staff than last year were satisfied with the quality of work and patient<br />
care that they are able to deliver and this is one of the <strong>Trust</strong>’s largest local changes since the<br />
2009 survey. Some areas requiring focus are highlighted as:<br />
• Low levels of staff motivation at work.<br />
• Staff not feeling there are good opportunities to develop their potential at work.<br />
• Staff not feeling that they receive the necessary job related training or development.<br />
• Low numbers of staff reporting feeling that their role makes a difference to patients.<br />
There is clearly more work to be done in relation to making sure staff feel they can influence<br />
changes to their work, use their initiative and help drive improvements in patient care. Staff<br />
engagement is recognised as the most important factor for increasing the effectiveness and<br />
productivity of an organisation.<br />
Organisational Development Programme<br />
Organisational Development (OD) work seeks to develop a learning organisation which is<br />
flexible and fit to deliver the transformational agenda. The OD programme sets out how we<br />
will address the concerns raised in the staff survey and through other sources of feedback.<br />
The programme will be supported by a newly re-focused team following the HR re-structure<br />
and progress on it will be reported directly to the <strong>Trust</strong> <strong>Board</strong> through the Workforce and OD<br />
Committee.<br />
3
Item 12<br />
The OD programme sets out the <strong>Trust</strong>’s plans to establish a “Leadership Academy”<br />
approach to developing the necessary skills and capability in our leaders at every level. One<br />
of the first areas of focus will be on skills to lead staff through change and to manage<br />
performance issues, which will be supported with new policies and procedures.<br />
In addition to the focus on leadership skills there will also be a focus on leadership behaviour<br />
with the launch of a self assessment behaviour tool linked to appraisal. Additionally, a key<br />
focus will be on developing a coaching approach to leading and for performance<br />
improvement as well as establishing a coaching network so that staff will be able to access a<br />
coach to support them.<br />
There will continue to be a focus on staff engagement with further Staff Forums to engage<br />
with staff on issues at the heart of the <strong>Trust</strong>. Further use of the Listening into Action model<br />
will be embedded across the <strong>Trust</strong>.<br />
Key Positive Findings<br />
Staff pledge 1: To provide all staff with clear roles, responsibilities and rewarding jobs<br />
• 82% of those staff surveyed told us they are satisfied with the quality of care they give to<br />
patients, compared to 81% last year.<br />
• 68% of staff in the <strong>Trust</strong> agreed with at least two of the following three statements: that<br />
they are satisfied with the quality of care they give to patients; that they are able to deliver<br />
the patient care they aspire to; and that they are able to do their job to a standard they<br />
are personally pleased with. It is a better score than in 2009, when the <strong>Trust</strong> scored 62%.<br />
Staff pledge 2: To provide all staff with personal development, access to appropriate<br />
training for their jobs and line management support to succeed<br />
• 47% of staff surveyed have had equality and diversity training in the last 12 months, 6<br />
percentage points higher than the national average for all <strong>Trust</strong>s.<br />
• 46% of staff told us that they had had training for handling confidential information, 2%<br />
higher than the national average for all <strong>Trust</strong>s. 43% also told us that they had had major<br />
incident training, 6 percentage points higher than the national average for all <strong>Trust</strong>s.<br />
• 72% of our staff felt that their line managers were supportive in a crisis. 2 percentage<br />
points higher than the national average for all <strong>Trust</strong>s.<br />
• 85% of staff reported to have had an appraisal in the last 12 months; 12 percentage point<br />
increase on last year and 8 percentage points higher than the national average for all<br />
<strong>Trust</strong>s. <strong>Plymouth</strong> <strong>Hospitals</strong> NHS <strong>Trust</strong> is in the best 20% of <strong>Trust</strong>s for having staff<br />
appraised in the last 12 months and having personal development plans in place.<br />
Staff pledge 3: To provide support and opportunities for staff to maintain their health,<br />
wellbeing and safety<br />
• 27% of staff reported feeling unwell as a result of work-related stress and is better than<br />
the national average (28%).<br />
• 14% of staff at the <strong>Trust</strong> said that, in the last year, they had been injured or felt unwell as<br />
a result of at least one of the following: moving and handling; needlestick and sharps<br />
injuries; slips, trips or falls; or exposure to dangerous substances. The <strong>Trust</strong>'s score of<br />
14% is below (better than) average when compared with <strong>Trust</strong>s of a similar type and it is<br />
also a better score than in 2009 when the <strong>Trust</strong> scored 20%.<br />
4
Item 12<br />
• 86% of staff felt that the <strong>Trust</strong> encourages the reporting of errors, this is a better result<br />
both on last year and compared to all <strong>Trust</strong>s. There was an 8% point increase from 2009<br />
in staff saying that they are given feedback on changes following incidents.<br />
• 76% of staff said they were aware of counselling services to support staff, 10 percentage<br />
points better than the all <strong>Trust</strong> average. 99% of our staff also said they were aware of the<br />
occupational health support, as opposed to the 96% all <strong>Trust</strong> average.<br />
Staff pledge 4: To engage staff in decisions that affect them, the services they provide<br />
and empower them to put forward ways to deliver better and safer services<br />
• 38% of staff felt senior managers encouraged them to suggest new ideas for improving<br />
services an improvement of 33% from last year.<br />
Key Areas for Improvement<br />
Staff pledge 1: To provide all staff with clear roles, responsibilities and rewarding jobs<br />
• Although a slight improvement on last year, only 58% of staff agreed they are able to<br />
deliver the patient care they aspire to, compared to the national average for all <strong>Trust</strong>s of<br />
70%.<br />
• 48% of staff said they could not meet the conflicting demands on them as opposed to<br />
42% nationally. 44% of staff agreed they had adequate material supplies and equipment<br />
to do their job, as opposed to the 57% average for all <strong>Trust</strong>s.<br />
• 36% of staff feel the <strong>Trust</strong> is committed to helping staff balance their work and home life,<br />
compared to 41% nationally.<br />
Staff pledge 2: To provide all staff with personal development, access to appropriate<br />
training for their jobs and line management support to succeed<br />
• 34% of staff felt there was strong support for training in their area of work in comparison<br />
to 43% nationally.<br />
• 44% of staff felt their appraisal had helped them improve how they do their job (nationally<br />
54%) and only 42% had received the training identified in their Personal Development<br />
Plans compared to 50% nationally.<br />
Staff pledge 3: To provide support and opportunities for staff to maintain their health,<br />
wellbeing and safety<br />
• 29% of staff reported being informed of incidents (35% nationally) and 32% of staff<br />
reported to being given feedback about changes made in response to reporting incidents<br />
(37% nationally).<br />
• 50% of staff said the last time they had experienced physical violence, either they or their<br />
colleague had reported it, this compares to a national average of 69% for all <strong>Trust</strong>s.<br />
Staff pledge 4: To engage staff in decisions that affect them, the services they provide<br />
and empower them to put forward ways to deliver better and safer services<br />
• 20% of staff believe senior managers try to involve staff in decisions that affect work as<br />
opposed to 24% nationally. 21% of staff believe that senior managers act on staff<br />
feedback, compared to 29% nationally.<br />
5
Item 12<br />
• 40% of staff feel that senior managers are committed to patient care, 10% les than the<br />
national average and 49% of staff told us they believe patient care is the top priority of<br />
the <strong>Trust</strong> (58% nationally).<br />
Other important issues<br />
• 39% of staff would recommend the <strong>Trust</strong> as a place of work, compared to 55% nationally.<br />
No change from last year’s position.<br />
• 53% of staff would recommend the <strong>Trust</strong> as a place to be treated, this represents a 3%<br />
point increase on 2009, but 10 % points less than the national average.<br />
Conclusion<br />
The messages from the nationally staff survey are compelling; there are encouraging signs<br />
of improvement in some areas and clear data about what needs to change from other<br />
responses. A key focus will be to raise levels of staff engagement and involvement across<br />
the whole organisation whilst at the same time raising the bar of leadership capability and<br />
behaviours. The OD programme will have the highest levels of support from the <strong>Board</strong> to<br />
deliver the key aspects of the people agenda.<br />
Recommendations<br />
1 Continue to support the development and implementation of the Organisational<br />
Development programme.<br />
2 Give priority to the leadership component of the <strong>Trust</strong> Interim Strategy.<br />
3 Ensure that “organisational health” measures around engagement, leadership,<br />
development and well-being are reported alongside other <strong>Trust</strong> performance metrics.<br />
6
Item 13<br />
SUMMARY REPORT<br />
<strong>Trust</strong> <strong>Board</strong> (Part 1) 25 <strong>March</strong> 2011<br />
Subject<br />
Prepared by<br />
Approved by<br />
Presented by<br />
NIHR Research & Development Capability Statement<br />
Martin Quinn, Academic Services Manager<br />
Medical Director<br />
Medical Director<br />
Purpose<br />
The R&D Operational Capability Statement provides a <strong>Board</strong> level<br />
operational framework which empowers a R&D Office to undertake the<br />
management of R&D within the Organisation. The National Institute of Health<br />
Research (NIHR) expects that all Organisations intending to sponsor or<br />
participate in research have a R&D Operational Capability Statement.<br />
Corporate Objectives<br />
Decision<br />
Approval<br />
Information<br />
Other<br />
Safety Quality Efficiency Workforce Health Governance<br />
• •<br />
Executive Summary<br />
The NIHR Research Support Services provide a national framework for NHS R&D Offices to<br />
offer a consistent professional service that manages risk at the right time with the right people<br />
and in a proportionate way. The R&D Operational Capability Statement in one of three<br />
elements of the Research Support Service initiative currently available. It includes an<br />
operational overview of R&D capabilities, services and interests and its approval empowers<br />
the R&D Office to undertake the management of R&D within the <strong>Trust</strong>.<br />
The Statement is included at Annex 1 to the detailed report and the <strong>Board</strong> should note that<br />
the format of this is mandated.<br />
Key Recommendations<br />
Approve the proposed R&D Operational Capability Statement.<br />
Assurance Framework<br />
The Statement sets out how the <strong>Board</strong> plans to meet its research related responsibilities.<br />
Next Steps<br />
The approved R&D Operational Capability Statement will be published internally on<br />
Healthnet. The NIHR is considering how a version of these statements in a format more<br />
appropriate for external users of R&D services might be made available through its website.<br />
•<br />
1
Item 13<br />
CQC Regulations<br />
Financial Implications<br />
Legal Implications<br />
Equality & Diversity<br />
Corporate Impact Assessment<br />
R&D policies and operating procedures are designed to protect the dignity,<br />
rights, safety and well-being of patients participating in clinical research.<br />
The <strong>Trust</strong>’s annual income for R&D activities is approximately £4m. In<br />
addition, the <strong>Trust</strong>’s participation in clinical trials in which the trial drugs are<br />
provided by industry saves the NHS £1m+ per annum.<br />
Clinical Research Studies are required to adhere to the Department of Health<br />
Research Governance Framework for Health and Social Care 2005. Clinical<br />
Trials, a subgroup of Clinical Research, are also subject to the Medicines for<br />
Human Use (Clinical Trials) Regulations 2004 and subsequent amendments<br />
and have a legal requirement to comply with Guidelines for Good Clinical<br />
Practice (GCP).<br />
Most Clinical Research Studies require the processing and/or storage of<br />
personal and sensitive information relating to living individuals (e.g. patients)<br />
and is therefore governed by the Data Protection Act 1998.<br />
R&D standard operating procedures are designed to ensure compliance with<br />
all of the above.<br />
No impact on E&D requirements is anticipated.<br />
2
Item 13<br />
DETAILED REPORT<br />
<strong>Trust</strong> <strong>Board</strong> (Part 1) 25 <strong>March</strong> 2011<br />
Subject<br />
Prepared by<br />
Approved by<br />
Presented by<br />
NIHR Research & Development Capability Statement<br />
Martin Quinn, Academic Services Manager<br />
Medical Director<br />
Medical Director<br />
Purpose<br />
The R&D Operational Capability Statement provides a board level operational framework<br />
which empowers a R&D Office to undertake the management of R&D within the <strong>Trust</strong>. The<br />
National Institute of Health Research (NIHR) expects that all organisations intending to<br />
sponsor or participate in research have a R&D Operational Capability Statement.<br />
Background<br />
The vision of the National Institute for Health Research (NIHR) is to improve the health and<br />
wealth of the nation through research. NHS <strong>Trust</strong> R&D Offices are contributing to this vision<br />
by harmonising and streamlining complex local research management and governance<br />
processes in a risk-proportionate environment. This is being managed through the NIHR<br />
Research Support Services initiative which provides a national framework for local NHS<br />
research management.<br />
The NIHR Research Support Services provide a national framework for R&D Offices to offer<br />
a consistent professional service that manages risk at the right time with the right people and<br />
in a proportionate way.<br />
To provide a consistent professional service, <strong>Trust</strong>s need standard operating procedures<br />
(SOPs) that are relevant to the <strong>Trust</strong> and to the research study, and that are supported by an<br />
appropriate local capability statement and risk management plan. The NIHR Research<br />
Support Services Framework, includes guidelines for SOPs, capability statements and risk<br />
management. NIHR has asked <strong>Trust</strong>s to implement these from April 2011.<br />
The <strong>Trust</strong> already has a comprehensive set of SOPs for R&D. The <strong>Trust</strong>’s Research<br />
Governance manager is currently reviewing the NIHR’s guideline SOPs with a view to filling<br />
gaps and adopting consistent practice. The second element of the framework currently<br />
available is a planning tool which provides a quick assessment of likely operational risks in<br />
giving NHS Permission and in study delivery. The R&D Manager is currently trialling this<br />
tool. The third element of the framework currently in place is the R&D Operational Capability<br />
Statement which the <strong>Board</strong> is being invited to consider.<br />
The Capability Statement<br />
The R&D Operational Capability Statement provides a board level operational framework<br />
which empowers a R&D Office to undertake the management of R&D within the <strong>Trust</strong>. The<br />
Statement gives the R&D Office an approved management framework, supporting timely and<br />
efficient decisions whether to support a particular research Study. It empowers the R&D<br />
Office to undertake its responsibilities with support from staff within clinical and other service<br />
departments in the <strong>Trust</strong>.<br />
3
Item 13<br />
The Statement is not meant to be read as an R&D Strategy or as a report on activity. The<br />
current R&D Strategy is being reviewed by the R&D Committee and an annual report on<br />
activity will be provided to the <strong>Trust</strong> <strong>Board</strong> for its meeting in June. The Statement will be<br />
reviewed at least annually and in future will be provided to the <strong>Board</strong> as an appendix to the<br />
R&D Annual Report.<br />
The appended Statement is in a format to provide information to the <strong>Trust</strong> <strong>Board</strong> and<br />
internally within the <strong>Trust</strong> and follows the template prescribed by the NIHR.<br />
Conclusion<br />
The NIHR Research Support Services provide a national framework for local NHS research<br />
management. This framework of best practice enables front line staff to collaborate in<br />
offering a consistent professional streamlined service, with proportionate procedures, to<br />
support clinical research in the NHS in England. The R&D Operational Capability Statement<br />
is one of the three elements of the framework currently available and <strong>Trust</strong>s have been<br />
asked by the NIHR to have an approve Statement in place by April 2011.<br />
4
Item 13<br />
Operational Capability Statement Annex 1<br />
NIHR Guideline B01 - R&D Operational Capability Statement<br />
Version History<br />
Version no. Valid from Valid to Date approved Approved by Updated by<br />
RDOCS 001 01/04/2011 31/03/13 25/03/2011 <strong>Trust</strong> <strong>Board</strong> R&D Office<br />
Contents<br />
Organisation R&D Management Arrangements<br />
Organisation Study Capabilities<br />
Organisation Services<br />
Organisation R&D Interests<br />
Organisation R&D Planning and Investments<br />
Organisation R&D Standard Operating Procedures Register<br />
Planned and Actual Studies Register<br />
Other Information<br />
Organisation R&D Management Arrangements<br />
Organisation Details<br />
Name of Organisation<br />
<strong>Plymouth</strong> <strong>Hospitals</strong> NHS <strong>Trust</strong><br />
R&D Lead / Director (with responsibility for reporting on R&D<br />
to the Organisation <strong>Board</strong>)<br />
Dr Simon Rule - Associate Medical Director for<br />
R&D<br />
Key Contact Details e.g. Research Governance Lead, NHS Permissions Signatory contact details<br />
Contact 1:<br />
Role:<br />
Academic Services Manager (Head of R&D<br />
Office)<br />
Name:<br />
Martin Quinn<br />
Contact Number: 01752 439849<br />
Contact Email:<br />
martin.quinn@phnt.swest.nhs.uk<br />
Contact 2:<br />
Role:<br />
R&D manager<br />
Name:<br />
Dr Lisa Vickers<br />
Contact Number: 01752 315114<br />
Contact Email:<br />
lisa.vickers@phnt.swest.nhs.uk<br />
Contact 3:<br />
Role:<br />
Clinical Trials Finance Manager<br />
Name:<br />
Corinna Mossop<br />
Contact Number: 01752 431046<br />
Contact Email:<br />
corinna.mossop@phnt.swest.nhs.uk<br />
Contact 4:<br />
Role:<br />
Research Governance Manager<br />
Name:<br />
Dr Chris Rollinson<br />
Contact Number: 01752 431045<br />
Contact Email:<br />
chris.rollinson@phnt.swest.nhs.uk<br />
Contact 5:<br />
Role:<br />
Lead Research Nurse (<strong>Trust</strong> wide)<br />
Name:<br />
Clare Meachin<br />
Contact Number: 01752 439102<br />
Contact Email:<br />
clare.meachin@phnt.swest.nhs.uk<br />
Contact 6:<br />
Role:<br />
Lead Research Nurse (Oncology)<br />
Name:<br />
Nicola Donlin<br />
Contact Number: 01752 431960<br />
Contact Email:<br />
nicola.donlin@phnt.swest.nhs.uk<br />
5
Information on staffing of the R&D Office<br />
R&D Office Roles<br />
(e.g. Governance, Contracts, etc)<br />
Whole Time Equivalent<br />
Item 13<br />
Comments<br />
indicate if part time/full time/shared/joint etc<br />
Academic Services Manager 1.0<br />
Also supports wider academic<br />
developments<br />
R&D Management and administration 3.3<br />
The 1.0 wte Assistant Research Manager<br />
post is shared with <strong>Plymouth</strong> Teaching<br />
PCT, South Devon Healthcare NHS <strong>Trust</strong><br />
and Torbay Care <strong>Trust</strong><br />
Research Advisor 1.0 Also supports <strong>Plymouth</strong> Teaching PCT<br />
Research Governance 1.8<br />
Clinical Trials Finance 3.7<br />
Total 10.8<br />
Lead Research Nurse (<strong>Trust</strong> wide) 0.93<br />
Lead Research Nurse (Oncology) 1.0<br />
Responsible for 45 (head count) research<br />
nurses and associated staff<br />
Responsible for 8 (head count) research<br />
nurses and associated staff<br />
Reporting Structures<br />
The <strong>Trust</strong>'s R&D Committee is responsible for the development of research strategy and the approval of<br />
research related policies.<br />
An annual report is submitted to the <strong>Trust</strong> <strong>Board</strong>.<br />
The Associate Medical Director for R&D represents the R&D Department on appropriate senior committees.<br />
6
Item 13<br />
Research Networks<br />
Research Network (name/location)<br />
Peninsula Comprehensive Research Network<br />
South West Dementia and Neurodegenerative diseases Network (DeNDRoN)<br />
South West Stroke Research Network<br />
South West Peninsula Diabetes Research Network<br />
National Cancer Research Network - Peninsula<br />
South West Medicines for Children Research Network<br />
Role/relationship of the Research Network eg host<br />
Organisation<br />
Member organisation<br />
Participating organisation<br />
Participating organisation<br />
Participating organisation<br />
Participating organisation<br />
Participating organisation<br />
Current Collaborations / Partnerships<br />
Organisation Name<br />
University of <strong>Plymouth</strong><br />
University of <strong>Plymouth</strong><br />
Peninsula College of<br />
Medicine and Dentistry<br />
Details of Collaboration / Partnership (eg University/Organisation<br />
Joint Office, external provider of pathology services to<br />
Organisation, etc, effective dates)<br />
The <strong>Trust</strong> and the University of <strong>Plymouth</strong> have a wide range of<br />
research links particularly with the Faculty of Health & Education<br />
and the School of Biomedical and Biological Sciences<br />
Weekly statistical advice clinics provided by the Centre for Health<br />
and Environmental Statistics<br />
The <strong>Trust</strong> and the Peninsula College of medicine and Dentistry<br />
have a wide range of research links including PenCLAHRC and<br />
PenCTU and are parties to a framework agreement on intellectual<br />
property.<br />
Contact Name<br />
Professor Graham Sewell (Fac of Health &<br />
Educ.)<br />
Professor Neil Avent (School of Biomedical<br />
and Biological Sciences)<br />
Sue Varley<br />
Nick Church - Research Services manager<br />
Email address<br />
graham.sewell@plymouth.ac.uk<br />
neil.avent@plymouth.ac.uk<br />
sue.varley@plymouth.ac.uk<br />
nick.church@pcmd.ac.uk<br />
Contact<br />
Number<br />
01752<br />
588817<br />
01752<br />
584884<br />
01752<br />
764437<br />
01392<br />
262917<br />
7
Organisation study capabilities<br />
Types of Studies Organisation has capabilities in (please tick applicable)<br />
CTIMPs<br />
(indicate Phases)<br />
Clinical Trial of a Medical Device Other Clinical Studies Human Tissue:<br />
Tissue Samples<br />
Studies<br />
As Sponsoring<br />
Organisation<br />
As Participating<br />
Organisation<br />
As Participant<br />
Identification Centre<br />
√<br />
Study Administering<br />
Questionnaires<br />
√ (phase 2-4) √ √ √ √ √<br />
√ (phase 1-4) √ √ √ √ √<br />
Qualitative<br />
Study<br />
Item 13<br />
OTHER<br />
Organisation Licences<br />
Licence Name Licence Details Licence Start Date (if<br />
applicable)<br />
Licence End Date (if<br />
applicable)<br />
Human Tissue Authority Licence Licence number is 12034 - The holder is PHNT. There is a separate licence for therapeutic use of tissue<br />
which Helmy Fekry is responsible for.<br />
10.05.10 No expiry date<br />
Organisation Services<br />
Clinical Service Departments<br />
Service Department Specialist facilities that may be provided (e.g. number/type of scanners) Contact Name within Service<br />
Department<br />
Contact number<br />
DCL/Microbiology/Pathology/Cytology Clinical Chemistry/haematology/cytology/pathology/coag/immunology Rob Wosley 01752 431357<br />
Imaging CT/X-Ray/MRI/Tomosynthesis/ultrasound/doplar Ann Pinder 01752 517646<br />
Pharmacy Dispensing / Aspectic Unit/ Repackaging Maggie Kalita 01752 763423<br />
Medical Physics IRMER Assessments / DEXA Scanning/radiotherapy/brachytherapy. Nick Rowles 01752 439669<br />
Breast Clinic Mammogram Dr Jim Steel 01752 517563<br />
Nuclear Medicine Bone Scans/MUGA/GFR/ARSAC licenses Dr Thomas Gruning 01752 792280<br />
Ophthalmology OCT/Fluorescein angiography. Mr Thomas Freegard 01752 439355<br />
Cardiology ECHO Linda Zacharkiw 01752 792659<br />
Chest Clinic Spirometry / Pulmonary Function Testing Andrew Collingwood 01752 763867<br />
Details of any<br />
internal agreement<br />
templates<br />
8
Item 13<br />
Management Support e.g. Finance, Legal Services, Archiving<br />
Department Specialist services that may be provided Contact Name within<br />
Service Department<br />
Contact email<br />
Contact<br />
number<br />
Central Medical<br />
Archiving of research study files Denise Roddy Denise.roddy@phnt.swest.nhs.uk 01752<br />
Records Library<br />
Legal and Contracts<br />
437086<br />
Laura Joines Laura.joynes@phnt.swest.nhs.uk 01752<br />
431057<br />
Advice on research study contracts. Refers to<br />
<strong>Trust</strong> solicitors as appropriate.<br />
Finance Overall Sarah Brampton Sarah.brampton@phnt.swest.nhs.uk 01752<br />
439088<br />
Personnel<br />
Processing of Research Passports and<br />
Honorary contracts.<br />
Carole Davey Carole.davey@phnt.swest.nhs.uk 01752<br />
439787<br />
Details of any internal agreement<br />
templates<br />
Standard ABPI commercial /<br />
non-com contracts<br />
Organisation R&D interests<br />
Organisation R&D Areas of Interest<br />
Details Contact Name Contact Number<br />
Area of Interest<br />
Oncology Supported by the National Cancer Research Network. (63 NCRN studies in period 2009 -11)<br />
Nicola Donlin 01752 431960<br />
We have a broad portfolio of studies, including haematology, breast, gynaecology, lung, upper GI, renal, urology, brain, skin,<br />
colorectal and palliative care with Commercial & Non-Commercial sponsors.<br />
Diabetes Supported by the Diabetes Research Network. (15 DRN studies in period 2009 -11) Clare Meachin 01752 439102<br />
Stroke Supported by the Stroke Research Network. (14 SRN studies in period 2009 -11) Clare Meachin 01752 439102<br />
Medicines for<br />
Children<br />
Dementias and<br />
Neurodegenerative<br />
Diseases<br />
Supported by the Medicine for Children Research Network. (8 MCRN studies in period 2009 -11) Clare Meachin 01752 439102<br />
Supported by the Dementias and Neurodegenerative Diseases Research Network. (6 DeNDRoN studies in period 2009 -11)<br />
The <strong>Trust</strong> holds a £2m NIHR Programme Grant for Applied Research: ‘Clinical Trials Methods in Neurodegenerative<br />
Diseases’<br />
Clare Meachin<br />
Professor John<br />
Zajicek<br />
01752 439102<br />
Research<br />
throughout the<br />
<strong>Trust</strong><br />
There is a broad portfolio of studies, with Commercial & Non-Commercial sponsors, in all areas of the <strong>Trust</strong>. Specialist areas<br />
of interest for research are: Cardiovascular, Anaesthetics, Critical Care, Injury & Accident, Hepatology, Reproductive Health<br />
and Childbirth. In addition, the generic Portfolio Research Team is working across all areas to facilitate and enable<br />
recruitment. This involves working with clinicians in their specialist areas and offering research expertise in the set up,<br />
screening and recruitment phase of studies; for example dermatology, metabolic and endocrine, musculoskeletal, nervous<br />
systems disorders, renal and urogenital.<br />
Clare Meachin 01752 439102<br />
9
Specialty Group Membership (Local and National)<br />
National / Local Specialty Group<br />
National Hepatology<br />
National Reproductive health and childbirth<br />
National<br />
National<br />
Surgery<br />
Anaesthetics, peri-operative medicine<br />
and pain<br />
National Metabolic and endocrine<br />
Specialty Area (if only specific areas<br />
within group)<br />
Contact Name Contact Email<br />
Contact<br />
Number<br />
Dr M Cramp matthew.cramp@phnt.swest.nhs.uk 01752<br />
792725<br />
Professor R<br />
robert.freeman@phnt.swest.nhs.uk 01752<br />
Freeman<br />
763725<br />
Professor A<br />
andrew.kingsnoth@phnt.swest.nhs.uk 01752<br />
Kingsnorth<br />
763016<br />
Dr G Minto gary.minto@phnt.swest.nhs.uk 01752<br />
431736<br />
Professor T Wilkin terence.wilkin@phnt.swest.nhs.uk 01752<br />
792728<br />
Item 13<br />
Organisation R&D Planning and Investments<br />
Planned Investment<br />
Area of<br />
Description of Planned Investment Value of Investment Indicative dates<br />
Investment<br />
Staffing Clinical Research Training Fellowship - Hepatology £150K 2010-13<br />
Staffing Clinical Research Training Fellowship - Radiology £100K 2010-12<br />
Staffing Clinical Research Training Fellowship - Neurology £100K 2011-13<br />
The <strong>Trust</strong> <strong>Board</strong> approved a Research Strategy for 2009-13 which proposed establishing an investment framework for research activity which reflects research specialisations, methodologies and<br />
care programme benefits. The above decisions have been informed by such a framework but future plans are to be considered by a newly constituted R&D Committee.<br />
10
Organisation R&D Standard Operating Procedures Register<br />
Item 13<br />
<strong>Trust</strong> Generic<br />
Research SOP<br />
Ref Number<br />
G1<br />
SOP Title Version Valid<br />
from<br />
Valid to<br />
Preparation, Approval, Review and Issue Version 03 Current Oct-11<br />
of SOPs<br />
G2 R&D and Ethics Application Version 03 Current Dec-12<br />
G3<br />
Study Files and Filing- Investigational Version 04 Current Oct-11<br />
Medicinal Products<br />
G4<br />
Study files and filing Non-Investigational Version 03 Current Oct-11<br />
Medicinal Products<br />
G5 Delegation of duties Version 03 Current Oct-11<br />
G6<br />
Consent Procedures for Entry into a Version 04 Current Dec-11<br />
Research Study<br />
G7 Data Protection Version 04 Current Oct-11<br />
G8 Case Record Form Completion Version 03 Current Oct-11<br />
G9 Research Related Adverse Event Report Version 05 Current Dec-12<br />
G10 Archiving Version 04 Current Dec-12<br />
G11 Research Training Version 03 Current Oct-11<br />
G12<br />
Research Involving Medical Exposures Version 03 Current Feb-13<br />
(using Ionising Radiations)<br />
G13 Study Closure Version 02 Current Dec-12<br />
G14 Managing protocol amendments Version 01 Current Oct-11<br />
G15 Non-compliance reporting Version 02 Current Dec-12<br />
G16<br />
Document Control/version control Version 01 Current Nov-12<br />
general guideline<br />
G17 Urgent Safety measures Version 02 Current Dec-12<br />
G18 Conflicts of interest Version 01 Current Oct-11<br />
G19 Suspected research fraud Version 01 Current Jan-12<br />
G20 Human Tissue for Research Version 01 Current Dec-11<br />
G21<br />
Recording of research information in Version 01 Current Oct-11<br />
patient medical notes<br />
G22 Research Passport Version 01 Current Jan-12<br />
G23<br />
Provision of virology test information to Version 01 Current Jan-12<br />
clinical trial volunteers.<br />
G24 Study Start up. Version 01 Current Dec-12<br />
G25 Data Management Version 01 Current Dec-12<br />
G26<br />
Database management, security, design Version 01 Current Dec-12<br />
and validation<br />
G27<br />
Computerised Systems for Supporting Version 01 Current Jan-12<br />
Clinical Trials<br />
G28 Case Report Forms Design Version 01 Current Dec-12<br />
G29 Statistical Analysis Plan Version 01 Current Dec-12<br />
G30 Randomisation & Blinding Version 01 Current Dec-12<br />
G31<br />
Preparing and Submitting Progress and<br />
Safety Reports<br />
Version 01 Current Dec-12<br />
11
R&D SOP Ref<br />
Number<br />
SOP Title Version Valid<br />
from<br />
Item 13<br />
Valid to<br />
R&D 1 Trial Risk Assessment Version 03 Current Oct-11<br />
R&D 2 Research Governance Audit Version 04 Current Jan-12<br />
R&D 3<br />
Study suspension and or discontinuation Version 05 Current Dec-12<br />
due to failure to comply with Research<br />
Governance Framework<br />
R&D 4<br />
Reporting SUSARs in CTIMPs for PHNT Version 04 Current Dec-12<br />
UK sponsored studies.<br />
R&D 5 Reporting of serious breaches in CTIMPs Version 02 Current Dec-12<br />
R&D 6<br />
Process of Agreement of the <strong>Trust</strong> to Version 01 Current Dec-12<br />
take on the Sponsorship of Studies<br />
R&D 7<br />
Management & maintenance of<br />
Version 01 Current Jan-12<br />
agreements and Contracts<br />
R&D 8 Contracting with 3rd parties Version 01 Current Jan-12<br />
R&D 9 Contract review Version 01 Current Jan-12<br />
R&D 10 Study specific R&D files DRAFT<br />
Version 01<br />
Sent for<br />
review<br />
R&D 11 Study tracking DRAFT<br />
Version 01<br />
Sent for<br />
review<br />
R&D 12 Regulatory Inspection Version 01 Current Oct-11<br />
R&D 13<br />
Review of Pharmacy details for Clinical Version 01 Current Jan-12<br />
Trials<br />
R&D 14 Monitoring Version 01 Current Jan-12<br />
R&D Guidance<br />
Title Version Valid Valid to<br />
document Ref<br />
Number<br />
from<br />
RGD 1<br />
Guidance on who can be identified as a Version 01 Current Jan-12<br />
Professional Legal Representative<br />
(PrLR)<br />
RGD 2 Consent in Emergency Research Version 01 Current Jan-12<br />
RGD 3<br />
Guideline notes on - Trial Steering Version 01 Current Jan-12<br />
RDG 4<br />
Committee (TSC).<br />
Guidance on contracting for PHNT<br />
sponsored IMP Trials<br />
Version 01<br />
Sent for<br />
review<br />
12
Information on the processes used for managing Research Passports<br />
Item 13<br />
The R&D office will process research passports on behalf of the <strong>Trust</strong>. Researchers should contact Dr Lisa<br />
Vickers, R&D Manager, Telephone 10752 315114 or e-mail lisa.vickers@phnt.swest.nhs.uk<br />
Escalation Process<br />
See SOP R&D 3 - Study suspension and or discontinuation due to failure to comply with Research Governance<br />
Framework - Version 05 - for review Dec 2012<br />
Planned and Actual Studies Register<br />
The <strong>Trust</strong> has maintained a comprehensive database of planned and actual research studies on ReDA<br />
(research management software) since 1997.<br />
Other Information<br />
The R&D Office collects details of staff publications each calendar year. Research published in substantive<br />
research papers in 2009 is detailed on the HealthNet at:<br />
http://nww.picts.nhs.uk/PHNetLive/Portals/57ad7180-c5e7-49f5-b282-<br />
c6475cdb7ee7/ingramp_Research%20Pubs%202009.xls<br />
In 2010 responsibility for matters relating to the protection and commercialisation of intellectual property was<br />
transferred from the Finance Department to the R&D Office. The policy for the management of intellectual<br />
property (TRW.RAD.POL.149.2) is available to staff in the <strong>Trust</strong> documents folder.<br />
13
Item 14<br />
SUMMARY REPORT<br />
<strong>Trust</strong> <strong>Board</strong> (Part 1) Date: 25 <strong>March</strong> 2011<br />
Subject<br />
Prepared by<br />
Approved by<br />
Presented by<br />
<strong>Trust</strong> Seal<br />
<strong>Board</strong> Secretary<br />
Lee Budge<br />
<strong>Board</strong> Secretary<br />
Purpose<br />
The purpose of this report is to update the <strong>Board</strong> on the use of the <strong>Trust</strong>’s Seal.<br />
Corporate Objectives<br />
Decision<br />
Approval<br />
Information<br />
Other<br />
Safety Quality Efficiency Workforce Health Governance<br />
•<br />
Executive Summary<br />
In accordance with the <strong>Trust</strong>’s Standing Orders, the <strong>Trust</strong> <strong>Board</strong> receives regular quarterly<br />
updates on the use of the <strong>Trust</strong>’s Seal. The documents signed and sealed since the last report in<br />
December 2010, until 9 <strong>March</strong> 2011, are listed below:<br />
Contract Description Between PHNT and: Date<br />
•<br />
JCT 2005 Minor Works Building Contract for<br />
internal conversion and change of use of<br />
cloakroom area at <strong>Plymouth</strong> Guildhall to digital<br />
mammography unit<br />
SML Contractors 09.12.10<br />
Deed of Variation, 1 Brest Road, <strong>Plymouth</strong><br />
JCT 2005 Minor Works Building Contract for<br />
Argyll Ward alterations<br />
JCT 2005 Intermediate Form of Building Contract<br />
for Stannon Ward Refurbishment<br />
Lone Eagle Properties<br />
Ltd<br />
KMS Contract Building<br />
Services<br />
Steve Mitchell Ltd<br />
(operating as SML<br />
Contracts)<br />
09.12.10<br />
23.12.10<br />
23.12.10<br />
Lease, Unit 4, Eaton Business Park, Thornbury<br />
Road, Estover, <strong>Plymouth</strong><br />
Variation of an Agreement to Lease, premises at<br />
Eaton Business Park, Thornbury Road, Estover,<br />
<strong>Plymouth</strong><br />
The Una Group Ltd 23.12.10<br />
The Una Group Ltd 12.01.11<br />
Key Recommendations<br />
The <strong>Board</strong> is asked to note this report.<br />
Assurance Framework<br />
This report demonstrates good governance and compliance with Standing Orders.<br />
Next Steps<br />
Not applicable.
Corporate Impact Assessment<br />
CQC Regulations Not applicable.<br />
Financial Implications Not applicable.<br />
Legal Implications Adherence to Standing Orders demonstrates probity and good governance.<br />
Equality & Diversity Not applicable
Performance Databook<br />
February 2011<br />
Part 1 <strong>Trust</strong> <strong>Board</strong><br />
… safety | quality | efficiency | health
Performance Information Databook<br />
Page No<br />
Performance Databook<br />
Safety Objective Databook 1<br />
‣ Accident and Emergency 4 Hour Standard 2<br />
‣ A&E Breach Reasons 3<br />
‣ Accident and Emergency 2 Hour Standard 4<br />
‣ Accident and Emergency Median Waits 4<br />
‣ Ambulance Handover Times 5<br />
‣ Emergency Inpatients 6<br />
‣ Delayed transfers of care 7<br />
‣ MRSA Bacteraemia/ Clostridium Difficile infection 8<br />
‣ MRSA Screening 9<br />
‣ Stroke Quality Outcomes 10<br />
Quality Objective Databook 13<br />
‣ Out-Patient Waiting Times and Related Activity 14<br />
‣ In-Patient & Day Care Waiting Times Related Activity 16<br />
‣ RTT Performance – Admitted Patients 18<br />
‣ RTT Performance – Non Admitted Patients 19<br />
‣ RTT – other information including median wait times 20<br />
‣ Rapid Access Chest Pain Clinic 25<br />
‣ Angiogram Waiting Times 25<br />
‣ Revascularisation Waiting Times 25<br />
‣ Diagnostic Waiting Times 26<br />
‣ Planned Waiting Lists 29<br />
‣ Suspended Waiting Lists 30<br />
‣ Cancelled Operations 31<br />
‣ Choose and book slot availability 33<br />
‣ Cancer Targets 34<br />
‣ Reperfusion Waiting Times 41<br />
Efficiency and Business Management Objective Databook 42<br />
‣ Income and Expenditure Performance Against Plan 43<br />
Health Objective Databook 44<br />
‣ Access to GUM Clinics 45<br />
‣ Breast Feeding 46<br />
‣ Smoking During Pregnancy 47<br />
‣ Maternity Data Quality 48<br />
‣ Participation in Heart Disease Audits 49<br />
‣ Data Quality on Ethic Group 50<br />
Workforce Objective Databook 51<br />
‣ Human Resources Scorecard 52
SAFETY OBJECTIVE<br />
PERFORMANCE REPORT<br />
Page 1
11<br />
TOTAL TIME IN A&E<br />
Maintain the 4 hour maximum wait in A&E from arrival to admission, transfer or discharge<br />
Current Month: February 2011<br />
Feb-11 Qtr 1 Qtr 2 Qtr 3<br />
Qtr 4 To<br />
Date<br />
Year To<br />
Date<br />
Total Patients Seen in A&E 6539 24550 24581 22019 13592 84742<br />
Total No. Admitted, Transferred or Discharged Within 4 Hours 6298 24042 24065 20973 12949 82029<br />
% Within 4 Hours - <strong>Plymouth</strong> <strong>Hospitals</strong> NHS <strong>Trust</strong> Only 96.31% 97.93% 97.90% 95.25% 95.27% 96.80%<br />
% Within 4 Hours Including Additional Community MIUs 97.70% 98.70% 98.67% 97.00% 97.04% 97.98%<br />
4 Hour Internal Standard 98% 98% 98% 98% 98% 98%<br />
4 Hour National Standard 95% 95% 95% 95% 95% 95%<br />
100%<br />
98%<br />
96%<br />
94%<br />
92%<br />
90%<br />
% Admitted, Transferred or Discharged Within 4 Hours - PHNT Only<br />
Apr-06<br />
May-<br />
Jun-06<br />
Jul-06<br />
Aug-06<br />
Sep-06<br />
Oct-06<br />
Nov-06<br />
Dec-06<br />
Jan-07<br />
Feb-07<br />
Mar-07<br />
Apr-07<br />
May-<br />
Jun-07<br />
Jul-07<br />
Aug-07<br />
Sep-07<br />
Oct-07<br />
Nov-07<br />
Dec-07<br />
Jan-08<br />
Feb-08<br />
Mar-08<br />
Apr-08<br />
May-<br />
Jun-08<br />
Jul-08<br />
Aug-08<br />
Sep-08<br />
Oct-08<br />
Nov-08<br />
Dec-08<br />
Jan-09<br />
Feb-09<br />
Mar-09<br />
Apr-09<br />
May-<br />
Jun-09<br />
Jul-09<br />
Aug-09<br />
Sep-09<br />
Oct-09<br />
Nov-09<br />
Dec-09<br />
Jan-10<br />
Feb-10<br />
Mar-10<br />
Apr-10<br />
May-<br />
Jun-10<br />
Jul-10<br />
Aug-10<br />
Sep-10<br />
Oct-10<br />
Nov-10<br />
Dec-10<br />
Jan-11<br />
Feb-11<br />
Actual Monthly<br />
National Standard<br />
100%<br />
99%<br />
98%<br />
97%<br />
96%<br />
95%<br />
94%<br />
93%<br />
92%<br />
% Admitted, Transferred or Discharged Within 4 Hours - Includes Community MIUs<br />
AVERAGE DAILY A&E ATTENDANCES BY MONTH & SITE<br />
Apr May Jun Jul Aug Sep Oct Nov Dec Jan Feb Mar<br />
2009/10 Derriford 231 242 251 235 227 242 244 232 233 209 226 230<br />
REI 36 35 35 27 25 27 23 25 23 20 21 21<br />
TOTAL 267 277 286 262 253 269 267 258 256 229 247 252<br />
2010/11 Derriford 241 255 256 251 236 243 239 231 237 228 234<br />
REI 23 17 17 20 24 28 11 0 0 0 0<br />
TOTAL 264 272 273 270 260 271 250 231 237 228 234 0<br />
310<br />
290<br />
270<br />
250<br />
230<br />
210<br />
190<br />
170<br />
150<br />
Average Daily A&E Attenders by Site<br />
Derriford<br />
REI<br />
Apr-06<br />
Jun-06<br />
Aug-06<br />
Oct-06<br />
Dec-06<br />
Feb-07<br />
Apr-07<br />
Jun-07<br />
Aug-07<br />
Oct-07<br />
Dec-07<br />
Feb-08<br />
Apr-08<br />
Jun-08<br />
Aug-08<br />
Oct-08<br />
Dec-08<br />
Feb-09<br />
Apr-09<br />
Jun-09<br />
Aug-09<br />
Oct-09<br />
Dec-09<br />
Feb-10<br />
Apr-10<br />
Jun-10<br />
Aug-10<br />
Oct-10<br />
Dec-10<br />
Feb-11<br />
Apr-06<br />
May-<br />
Jun-06<br />
Jul-06<br />
Aug-06<br />
Sep-06<br />
Oct-06<br />
Nov-06<br />
Dec-06<br />
Jan-07<br />
Feb-07<br />
Mar-07<br />
Apr-07<br />
May-<br />
Jun-07<br />
Jul-07<br />
Aug-07<br />
Sep-07<br />
Oct-07<br />
Nov-07<br />
Dec-07<br />
Jan-08<br />
Feb-08<br />
Mar-08<br />
Apr-08<br />
May-<br />
Jun-08<br />
Jul-08<br />
Aug-08<br />
Sep-08<br />
Oct-08<br />
Nov-08<br />
Dec-08<br />
Jan-09<br />
Feb-09<br />
Mar-09<br />
Apr-09<br />
May-<br />
Jun-09<br />
Jul-09<br />
Aug-09<br />
Sep-09<br />
Oct-09<br />
Nov-09<br />
Dec-09<br />
Jan-10<br />
Feb-10<br />
Mar-10<br />
Apr-10<br />
May-<br />
Jun-10<br />
Jul-10<br />
Aug-10<br />
Sep-10<br />
Oct-10<br />
Nov-10<br />
Dec-10<br />
Jan-11<br />
Feb-11<br />
Actual Monthly<br />
National Standard<br />
100%<br />
99%<br />
98%<br />
97%<br />
96%<br />
95%<br />
94%<br />
Cumulative Performance By Week - PHNT Only<br />
09/10 10/11 Target 08/09<br />
Week 1<br />
Week 2<br />
Week 3<br />
Week 4<br />
Week 5<br />
Week 6<br />
Week 7<br />
Week 8<br />
Week 9<br />
Week 10<br />
Week 11<br />
Week 12<br />
Week 13<br />
Week 14<br />
Week 15<br />
Week 16<br />
Week 17<br />
Week 18<br />
Week 19<br />
Week 20<br />
Week 21<br />
Week 22<br />
Week 23<br />
Week 24<br />
Week 25<br />
Week 26<br />
Week 27<br />
Week 28<br />
Week 29<br />
Week 30<br />
Week 31<br />
Week 32<br />
Week 33<br />
Week 34<br />
Week 35<br />
Week 36<br />
Week 37<br />
Week 38<br />
Week 39<br />
Week 40<br />
Week 41<br />
Week 42<br />
Week 43<br />
Week 44<br />
Week 45<br />
Week 46<br />
Week 47<br />
Week 48<br />
Week 49<br />
Week 50<br />
Week 51<br />
Week 52<br />
Page 2
A&E BREACH REASONS 2010/11<br />
Apr May Jun Jul Aug Sep Oct Nov Dec Jan Feb Mar<br />
YTD<br />
Waiting for<br />
assessment 110 68% 95 61% 80 50% 74 42% 75 60% 103 44% 117 48% 87 52% 279 59% 310 56% 158 66% 1488 55%<br />
Waiting for<br />
diagnostic 5 3% 5 3% 12 8% 8 5% 8 6% 5 2% 6 2% 5 3% 9 2% 3 1% 5 2% 71 3%<br />
Waiting for<br />
treatment 27 17% 25 16% 30 19% 39 22% 25 20% 46 20% 44 18% 29 17% 59 13% 52 9% 41 17% 417 16%<br />
Waiting for<br />
specialist 7 4% 10 6% 10 6% 11 6% 4 3% 16 7% 16 7% 5 3% 20 4% 17 3% 8 3% 124 5%<br />
Waiting for<br />
portering 0 0% 1 1% 2 1% 2 1% 1 1% 3 1% 2 1% 2 1% 2 0% 5 1% 0 0% 20 1%<br />
Waiting for<br />
transport 0 0% 0 0% 2 1% 0 0% 0 0% 3 1% 0 0% 0 0% 5 1% 1 0% 3 1% 14 1%<br />
Waiting for<br />
bed 7 4% 17 11% 24 15% 12 7% 7 6% 53 23% 55 22% 34 20% 85 18% 153 28% 17 7% 464 17%<br />
Other 5 3% 4 3% 0 0% 31 18% 5 4% 3 1% 5 2% 6 4% 12 3% 10 2% 7 3% 88 3%<br />
TOTAL 161 157 160 177 125 232 245 168 471 551 239 2686<br />
600<br />
500<br />
400<br />
300<br />
200<br />
100<br />
0<br />
A&E Breaches By Reason 2010/11<br />
Apr May Jun Jul Aug Sep Oct Nov Dec Jan Feb Mar<br />
Other<br />
Waiting for bed<br />
Waiting for transport<br />
Waiting for portering<br />
Waiting for specialist<br />
Waiting for treatment<br />
Waiting for diagnostic<br />
Waiting for assessment<br />
Page 3
11<br />
TOTAL TIME IN A&E<br />
Achieve a maximum of 2 hrs in A&E from arrival to admission, transfer or discharge by <strong>March</strong><br />
2011 for 60% of patients<br />
Current Month: February 2011<br />
% Within 2 Hours - <strong>Plymouth</strong><br />
Target<br />
Apr May Jun Jul Aug Sep Oct Nov Dec Jan Feb Mar<br />
42.6% 41.3% 44.9% 42.6% 43.4% 41.8% 40.0% 40.3% 34.3% 35.9% 31.2%<br />
52.5% 52.5% 52.5% 55.0% 55.0% 55.0% 55.0% 55.0% 55.0% 55.0% 55.0%<br />
60%<br />
% Admitted, Transferred or Discharged Within 2 Hours - PHNT Only<br />
50%<br />
40%<br />
30%<br />
20%<br />
10%<br />
0%<br />
Apr-09<br />
May-09<br />
Jun-09<br />
Jul-09<br />
Aug-09<br />
Sep-09<br />
Oct-09<br />
Nov-09<br />
Dec-09<br />
Jan-10<br />
Feb-10<br />
Mar-10<br />
Apr-10<br />
May-10<br />
Jun-10<br />
Jul-10<br />
Aug-10<br />
Sep-10<br />
Oct-10<br />
Nov-10<br />
Dec-10<br />
Jan-11<br />
Feb-11<br />
Actual Monthly<br />
Target Monthly<br />
Median Wait (Mins) In A&E (From Arrival To Discharge Transfer Or Admission)<br />
Apr May Jun Jul Aug Sep Oct Nov Dec Jan Feb Mar<br />
2010/11 Total Median 149 148 137 148 151 155 149 144 161 154 159<br />
Minors Median 121 119 107 120 117 125 119 108 121 120 132<br />
Majors Median 206 210 205 206 205 213 210 210 219 213 208<br />
250<br />
A&E Median Wait Times<br />
Total Median Minors Median Majors Median<br />
200<br />
150<br />
100<br />
50<br />
0<br />
Apr-09<br />
May-09<br />
Jun-09<br />
Jul-09<br />
Aug-09<br />
Sep-09<br />
Oct-09<br />
Nov-09<br />
Dec-09<br />
Jan-10<br />
Feb-10<br />
Mar-10<br />
Apr-10<br />
May-10<br />
Jun-10<br />
Jul-10<br />
Aug-10<br />
Sep-10<br />
Oct-10<br />
Nov-10<br />
Dec-10<br />
Jan-11<br />
Feb-11<br />
Page 4
AMBULANCE HANDOVER TIMES<br />
Maximum of 10% waiting > 15 minutes from arrival to transfer in A&E/MAU by 31 <strong>March</strong> 2010 and zero patients<br />
waiting > 30 mins from arrival to transfer in A&E/MAU by 31 <strong>March</strong> 2009<br />
Apr May Jun Jul Aug Sep Oct Nov Dec Jan Feb Mar<br />
2010/11 Total Handovers 2741 2948 2744 2919 2807 2764 3030 2787 3296 2929 2734<br />
No. Waiting >15 mins 544 533 565 352 188 233 289 277 402 230 240<br />
% Waiting > 15 mins 20% 18% 21% 12% 7% 8% 10% 10% 12% 8% 9%<br />
Target 10% 10% 10% 10% 10% 10% 10% 10% 10% 10% 10% 10%<br />
No. Waiting >30 mins 66 69 64 42 30 46 52 45 63 52 29<br />
% Waiting > 30 mins 2% 2% 2% 1% 1% 2% 2% 2% 2% 2% 1%<br />
Target 0% 0% 0% 0% 0% 0% 0% 0% 0% 0% 0% 0%<br />
35%<br />
30%<br />
25%<br />
20%<br />
15%<br />
10%<br />
5%<br />
0%<br />
Ambulance Handover Times - % waiting > 15 mins<br />
% > 15 mins<br />
Target<br />
Apr-09<br />
May-09<br />
Jun-09<br />
Jul-09<br />
Aug-09<br />
Sep-09<br />
Oct-09<br />
Nov-09<br />
Dec-09<br />
Jan-10<br />
Feb-10<br />
Mar-10<br />
Apr-10<br />
May-10<br />
Jun-10<br />
Jul-10<br />
Aug-10<br />
Sep-10<br />
Oct-10<br />
Nov-10<br />
Dec-10<br />
Jan-11<br />
Feb-11<br />
Mar-11<br />
6%<br />
5%<br />
4%<br />
3%<br />
2%<br />
1%<br />
0%<br />
Ambulance Handover Times - % waiting > 30 mins<br />
% > 30 mins<br />
Target<br />
Apr-09<br />
May-09<br />
Jun-09<br />
Jul-09<br />
Aug-09<br />
Sep-09<br />
Oct-09<br />
Nov-09<br />
Dec-09<br />
Jan-10<br />
Feb-10<br />
Mar-10<br />
Apr-10<br />
May-10<br />
Jun-10<br />
Jul-10<br />
Aug-10<br />
Sep-10<br />
Oct-10<br />
Nov-10<br />
Dec-10<br />
Jan-11<br />
Feb-11<br />
Mar-11<br />
Page 5
#<br />
Non Elective Inpatient Activity<br />
Current Month:<br />
February 2011<br />
Performance Against Plan :<br />
Comparison to Previous Year :<br />
Forecast Emergency Admissions 39,365 Actual Admissions to M11 2009/10 39,516<br />
Actual Emergency Admissions 40,399 Actual Admissions to M11 2010/11 40,399<br />
Variance (1,034) Variance<br />
(883)<br />
Variance (%) (2.6%) Variance (%)<br />
(2.2%)<br />
** Please note numbers in the tables above exclude Obstetrics & Gynaecology<br />
No. of FFCEs<br />
5500<br />
5000<br />
4500<br />
4000<br />
3500<br />
3000<br />
2500<br />
2000<br />
No. of FFCEs by Month<br />
Apr-05<br />
May-05<br />
Jun-05<br />
Jul-05<br />
Aug-05<br />
Sep-05<br />
Oct-05<br />
Nov-05<br />
Dec-05<br />
Jan-06<br />
Feb-06<br />
Mar-06<br />
Apr-06<br />
May-06<br />
Jun-06<br />
Jul-06<br />
Aug-06<br />
Sep-06<br />
Oct-06<br />
Nov-06<br />
Dec-06<br />
Jan-07<br />
Feb-07<br />
Mar-07<br />
Apr-07<br />
May-07<br />
Jun-07<br />
Jul-07<br />
Aug-07<br />
Sep-07<br />
Oct-07<br />
Nov-07<br />
Dec-07<br />
Jan-08<br />
Feb-08<br />
Mar-08<br />
Apr-08<br />
May-08<br />
Jun-08<br />
Jul-08<br />
Aug-08<br />
Sep-08<br />
Oct-08<br />
Nov-08<br />
Dec-08<br />
Jan-09<br />
Feb-09<br />
Mar-09<br />
Apr-09<br />
May-09<br />
Jun-09<br />
Jul-09<br />
Aug-09<br />
Sep-09<br />
Oct-09<br />
Nov-09<br />
Dec-09<br />
Jan-10<br />
Feb-10<br />
Mar-10<br />
Apr-10<br />
May-10<br />
Jun-10<br />
Jul-10<br />
Aug-10<br />
Sep-10<br />
Oct-10<br />
Nov-10<br />
Dec-10<br />
Jan-11<br />
Feb-11<br />
Mar-11<br />
Actual<br />
Plan<br />
4500<br />
4000<br />
No. of FFCEs by Month (Excludes Obstetrics & Gynaecology)<br />
Actual<br />
Plan<br />
No. of FFCEs<br />
3500<br />
3000<br />
2500<br />
2000<br />
Apr-05<br />
May-05<br />
Jun-05<br />
Jul-05<br />
Aug-05<br />
Sep-05<br />
Oct-05<br />
Nov-05<br />
Dec-05<br />
Jan-06<br />
Feb-06<br />
Mar-06<br />
Apr-06<br />
May-06<br />
Jun-06<br />
Jul-06<br />
Aug-06<br />
Sep-06<br />
Oct-06<br />
Nov-06<br />
Dec-06<br />
Jan-07<br />
Feb-07<br />
Mar-07<br />
Apr-07<br />
May-07<br />
Jun-07<br />
Jul-07<br />
Aug-07<br />
Sep-07<br />
Oct-07<br />
Nov-07<br />
Dec-07<br />
Jan-08<br />
Feb-08<br />
Mar-08<br />
Apr-08<br />
May-08<br />
Jun-08<br />
Jul-08<br />
Aug-08<br />
Sep-08<br />
Oct-08<br />
Nov-08<br />
Dec-08<br />
Jan-09<br />
Feb-09<br />
Mar-09<br />
Apr-09<br />
May-09<br />
Jun-09<br />
Jul-09<br />
Aug-09<br />
Sep-09<br />
Oct-09<br />
Nov-09<br />
Dec-09<br />
Jan-10<br />
Feb-10<br />
Mar-10<br />
Apr-10<br />
May-10<br />
Jun-10<br />
Jul-10<br />
Aug-10<br />
Sep-10<br />
Oct-10<br />
Nov-10<br />
Dec-10<br />
Jan-11<br />
Feb-11<br />
Mar-11<br />
VARIANCE FROM PLAN<br />
VARIANCE FROM 2009/10 ACTUAL<br />
SPECIALTY No. % No. %<br />
Anaesthestics & Theatres<br />
Chronic Pain 7 70.0% 6 66.7%<br />
Intensive Care 7 1.8% (40) (11.7%)<br />
Cardiothoracics<br />
Cardiac Surgery 28 10.6% 24 9.3%<br />
Cardiology (106) (26.5%) (102) (25.2%)<br />
Thoracic Surgery (10) (9.7%) (13) (13.0%)<br />
Vascular Surgery (41) (36.0%) (42) (37.2%)<br />
Children's Services<br />
Paediatrics 170 3.5% 289 5.8%<br />
Emergency Services<br />
A&E 303 9.7% 313 9.9%<br />
Acute Medicine (1,000) (23.2%) (550) (11.6%)<br />
Gastroenterology, Surgery & Renal Services<br />
Gastroenterology (206) (8.0%) 144 4.9%<br />
Hepatology (262) (63.7%) (382) (131.3%)<br />
Colorectal Surgery 625 17.5% 606 17.0%<br />
Upper GI Surgery (106) (5.8%) (113) (6.2%)<br />
Endoscopy (26) (41.3%) (35) (64.8%)<br />
General Surgery (479) (45.5%) (455) (42.2%)<br />
Urology (5) (13.2%) (4) (10.3%)<br />
Nephrology 4 1.1% (57) (19.8%)<br />
Haematology & Oncology<br />
Clinical Oncology 97 16.5% 82 14.3%<br />
Medical Oncology 12 34.3% 13 36.1%<br />
Palliative Medicine (4) (200.0%) (4) (200.0%)<br />
Clin Haematology 79 27.6% 72 25.8%<br />
Clin Immunology (3) (3)<br />
Head & Neck Surgery<br />
Plastic Surgery (129) (24.2%) (138) (26.3%)<br />
Plastic Surgery Hands (10) (76.9%) (11) (91.7%)<br />
Oral Surgery 36 14.4% 34 13.7%<br />
Dermatology 5 71.4% 5 71.4%<br />
Imaging<br />
Neuroradiology (2) (2)<br />
Radiology (1) (1)<br />
Medical Specialties<br />
Diabetic Medicine 0 0.0% 47 2.2%<br />
Endocrinology 36 100.0% 0<br />
General Medicine 1,100 99.9% 51 98.1%<br />
HCE (891) (49.2%) (348) (14.8%)<br />
Thoracic Medicine (247) (9.0%) (180) (6.4%)<br />
Neurosciences & Ophthalmology<br />
Neurosurgery 79 12.4% 67 10.7%<br />
Neurology (82) (6.3%) (81) (6.3%)<br />
Neurophysiology 2 100.0% 2 100.0%<br />
Orthopaedics & Rheumatology<br />
Trauma 83 4.3% 51 2.7%<br />
Rheumatology 12 75.0% 11 73.3%<br />
Reproductive, Womens & Neonatal Services<br />
Gynaecology 1,209 34.1% 1,195 33.8%<br />
Uro-Gynaecology (7) (41.2%) (8) (50.0%)<br />
PAC (6) (6)<br />
Obstetrics 1,090 9.9% 1,087 9.9%<br />
Neonatology (234) (22.3%) (248) (24.0%)<br />
TOTAL 1,265 2.3% 1,399 2.6%<br />
Page 6
DELAYED TRANSFERS OF CARE<br />
Current Month:<br />
February 2011<br />
The number of acute patients (aged 18 and over) whose transfer<br />
of care was delayed<br />
2009/10<br />
Cumulative Occupancy 42,043<br />
Delayed Transfers 1,271<br />
Percentage Delayed 3.0%<br />
Current Month<br />
Occupancy 3,085<br />
Delayed Transfers 170<br />
Percentage Delayed 5.5%<br />
Year To Date<br />
Cumulative Occupancy 37,341<br />
Delayed Transfers 1249<br />
Percentage Delayed 3.3%<br />
6.0%<br />
5.0%<br />
4.0%<br />
3.0%<br />
2.0%<br />
1.0%<br />
0.0%<br />
Apr-09<br />
Jun-09<br />
Aug-09<br />
Delayed Transfers as % of Occupancy<br />
Oct-09<br />
Dec-09<br />
Feb-10<br />
Apr-10<br />
Jun-10<br />
Aug-10<br />
Oct-10<br />
Dec-10<br />
Feb-11<br />
No of Delayed Patients by Council<br />
Council Apr-10 May-10 Jun-10 Jul-10 Aug-10 Sep-10 Oct-10 Nov-10 Dec-10 Jan-11 Feb-11 Mar-11 TOTAL<br />
<strong>Plymouth</strong> 63 47 66 72 56 56 51 51 21 48 94 0 625<br />
Devon 42 38 27 16 22 33 13 9 13 45 35 0 293<br />
Cornwall 60 31 26 23 20 24 12 7 30 57 41 0 331<br />
Other 0 0 0 0 0 0 0 0 0 0 0 0 0<br />
TOTAL 165 116 119 111 98 113 76 67 64 150 170 0 1249<br />
180<br />
160<br />
No. of Delayed Patients By Council<br />
No. of Delayed Patients<br />
140<br />
120<br />
100<br />
80<br />
60<br />
40<br />
Other<br />
Cornwall<br />
Devon<br />
<strong>Plymouth</strong><br />
20<br />
0<br />
Apr-10 May-10 Jun-10 Jul-10 Aug-10 Sep-10 Oct-10 Nov-10 Dec-10 Jan-11 Feb-11 Mar-11<br />
No of Beddays Used by Delayed Patients by Council<br />
Council Apr-10 May-10 Jun-10 Jul-10 Aug-10 Sep-10 Oct-10 Nov-10 Dec-10 Jan-11 Feb-11 Mar-11 TOTAL<br />
<strong>Plymouth</strong> 468 301 395 449 373 321 327 298 139 218 222 0 3511<br />
Devon 249 224 162 123 124 203 116 57 66 207 232 0 1763<br />
Cornwall 390 190 173 146 109 141 59 34 179 305 246 0 1972<br />
Other 0 0 0 0 0 0 0 0 0 0 0 0 0<br />
TOTAL 1107 715 730 718 606 665 502 389 384 730 700 0 7246<br />
1200<br />
No. of Beddays Used by Delayed Patients & Council<br />
1000<br />
No. of Beddays<br />
800<br />
600<br />
400<br />
200<br />
Other<br />
Cornwall<br />
Devon<br />
<strong>Plymouth</strong><br />
0<br />
Apr-10 May-10 Jun-10 Jul-10 Aug-10 Sep-10 Oct-10 Nov-10 Dec-10 Jan-11 Feb-11 Mar-11<br />
Page 7
11<br />
3<br />
MRSA Bacteraemia<br />
Current Month:<br />
February 2011<br />
Remain below <strong>Trust</strong> trajectory for Hospital apportioned cases i.e.<br />
post 48 hrs<br />
2010/11<br />
YTD<br />
Apr-10<br />
May-10<br />
Jun-10<br />
No. of Infections - All cases 8 2 0 1 1 2 1 1 0 0 0 0<br />
Less No. of Infections - Community<br />
apportioned (pre 48 hrs)<br />
No. of Infections - Hospital<br />
apportioned (post 48 hrs)<br />
Upper threshold - Hospital<br />
apportioned (post 48 hrs)<br />
Variance: better/(worse) than<br />
threshold<br />
(5) (2) (1) (1) (1)<br />
Jul-10<br />
Aug-10<br />
3 0 0 0 1 1 1 0 0 0 0 0<br />
Sep-10<br />
8 1 0 1 1 1 1 1 0 1 1 0 1<br />
5 1 0 1 0 0 0 1 0 1 1 0<br />
Oct-10<br />
Nov-10<br />
Dec-10<br />
Jan-11<br />
Feb-11<br />
Mar-11<br />
3.5<br />
3<br />
2.5<br />
2<br />
1.5<br />
1<br />
0.5<br />
0<br />
No. of MRSA <strong>Trust</strong> Apportioned cases against Upper Threshold<br />
Actual - Hospital<br />
Trajectory<br />
Apr-09<br />
May-09<br />
Jun-09<br />
Jul-09<br />
Aug-09<br />
Sep-09<br />
Oct-09<br />
Nov-09<br />
Dec-09<br />
Jan-10<br />
Feb-10<br />
Mar-10<br />
Apr-10<br />
May-10<br />
Jun-10<br />
Jul-10<br />
Aug-10<br />
Sep-10<br />
Oct-10<br />
Nov-10<br />
Dec-10<br />
Jan-11<br />
Feb-11<br />
Mar-11<br />
2<br />
Rolling 3 monthly average of No. of MRSA <strong>Trust</strong> Apportioned cases<br />
1.5<br />
1<br />
0.5<br />
0<br />
Clostridium Difficile<br />
Current Month:<br />
February 2011<br />
Remain below <strong>Trust</strong> trajectory for Hospital apportioned cases i.e.<br />
post 72 hours<br />
2010/11<br />
YTD<br />
Apr-10<br />
May-10<br />
Jun-10<br />
No. of Infections - All cases 55 3 2 6 11 5 5 3 3 3 6 8<br />
No. of Infections - Community<br />
apportioned (pre 72 hrs)<br />
(26) (2) (2) (3) (5) (1) 0 (1) (1) (2) (4) (5)<br />
No. of Infections - Hospital<br />
apportioned (post 72 hrs)<br />
29 1 0 3 6 4 5 2 2 1 2 3<br />
Upper threshold - Hospital<br />
apportioned (post 72 hrs) 115 13 11 9 11 9 8 8 8 8 16 14 13<br />
Variance: better/(worse) than<br />
threshold<br />
Jul-10<br />
Aug-10<br />
86 12 11 6 5 5 3 6 6 7 14 11<br />
Sep-10<br />
Oct-10<br />
Nov-10<br />
Dec-10<br />
Jan-11<br />
Feb-11<br />
Mar-11<br />
18<br />
16<br />
14<br />
12<br />
10<br />
8<br />
6<br />
4<br />
2<br />
0<br />
No. of C. Diff <strong>Trust</strong> Apportioned cases against Upper Threshold<br />
Actual - Hospital<br />
Trajectory<br />
Apr-09<br />
May-09<br />
Jun-09<br />
Jul-09<br />
Aug-09<br />
Sep-09<br />
Oct-09<br />
Nov-09<br />
Dec-09<br />
Jan-10<br />
Feb-10<br />
Mar-10<br />
Apr-10<br />
May-10<br />
Jun-10<br />
Jul-10<br />
Aug-10<br />
Sep-10<br />
Oct-10<br />
Nov-10<br />
Dec-10<br />
Jan-11<br />
Feb-11<br />
Mar-11<br />
Apr-<br />
09<br />
May-<br />
09<br />
Jun-<br />
09<br />
Jul-<br />
09<br />
Aug-<br />
09<br />
Sep-<br />
09<br />
Oct-<br />
09<br />
Nov-<br />
09<br />
Dec-<br />
09<br />
Jan-<br />
10<br />
Feb-<br />
10<br />
Mar-<br />
10<br />
Apr-<br />
10<br />
May-<br />
10<br />
Jun-<br />
10<br />
Jul-<br />
10<br />
Aug-<br />
10<br />
Sep-<br />
10<br />
Oct-<br />
10<br />
Nov-<br />
10<br />
Dec-<br />
10<br />
Jan-<br />
11<br />
Feb-<br />
11<br />
Mar-<br />
11<br />
Page 8
#<br />
MRSA SCREENING<br />
Current Month:<br />
February 2011<br />
ELECTIVE & NON ELECTIVE<br />
Mar-10<br />
Apr-10<br />
May-10<br />
Jun-10<br />
Jul-10<br />
Aug-10<br />
Sep-10<br />
Oct-10<br />
Nov-10<br />
Dec-10<br />
Jan-11<br />
Feb-11<br />
Mar-11<br />
YTD<br />
All MRSA Screens 6140 5746 6044 6182 6586 5782 6507 6707 7372 6363 7193 7193 71675<br />
All Admissions (Elective & Non<br />
Elective)<br />
6161 5446 5409 5773 5879 5549 5715 5392 5829 5461 5599 5285 61337<br />
Percentage Screened - Total 100% 106% 112% 107% 112% 104% 114% 124% 126% 117% 128% 136% 117%<br />
Patient Level Monitoring<br />
Every effort is being made to monitor this at patient level on a live, day-to-day basis. However, it does require matching lab data, PAS data and<br />
paper records from other organisations (which are often not received in a timely manner). As a result, it should be acknowledged that we cannot<br />
guarantee 100% accuracy.<br />
ELECTIVE<br />
No of Elective Admissions<br />
No of Screened Elective Adms<br />
Screening Target<br />
Percentage Screened - Patient level<br />
Mar-10<br />
Apr-10<br />
May-10<br />
Jun-10<br />
Jul-10<br />
Aug-10<br />
Sep-10<br />
3642 3043 2965 3344 3365 3159 3340 3124 3518 2927 3115 3075 34975<br />
3302 2773 2730 3106 3189 3041 3197 2990 3385 2821 2989 2933 33154<br />
95% 95% 95% 95% 95% 95% 95% 95% 95% 95% 95% 95% 95% 95%<br />
91% 91% 92% 93% 95% 96% 96% 96% 96% 96% 96% 95% 95%<br />
Oct-10<br />
Nov-10<br />
Dec-10<br />
Jan-11<br />
Feb-11<br />
Mar-11<br />
YTD<br />
100%<br />
95%<br />
90%<br />
85%<br />
80%<br />
75%<br />
70%<br />
Percentage of Elective Patients Subject to MRSA Target who have been Screened<br />
Mar-10 Apr-10 May-10 Jun-10 Jul-10 Aug-10 Sep-10 Oct-10 Nov-10 Dec-10 Jan-11 Feb-11 Mar-11<br />
Elective Admissions Subject to MRSA Screen<br />
Screening Target<br />
NON-ELECTIVE<br />
Mar-10<br />
Apr-10<br />
May-10<br />
Jun-10<br />
Jul-10<br />
No of Non-Elective Admissions 2519 2403 2444 2429 2514 2390 2375 2268 2311 2534 2484 2210 26362<br />
No of Screened Non-Elective Adms 1620 1659 1733 1681 1758 1636 1734 1899 2082 2249 2254 2074 20759<br />
Screening Improvement Trajectory 90% 90% 90% 90% 90% 90% 90% 90% 90% 90% 92% 93% 94% 90%<br />
Percentage Screened - Patient level 64% 69% 71% 69% 70% 68% 73% 84% 90% 89% 91% 94% 79%<br />
Aug-10<br />
Sep-10<br />
Oct-10<br />
Nov-10<br />
Dec-10<br />
Jan-11<br />
Feb-11<br />
Mar-11<br />
YTD<br />
100%<br />
Percentage of Non-Elective Patients Subject to MRSA Target who have been Screened<br />
90%<br />
80%<br />
70%<br />
60%<br />
50%<br />
Mar-10 Apr-10 May-10 Jun-10 Jul-10 Aug-10 Sep-10 Oct-10 Nov-10 Dec-10 Jan-11 Feb-11 Mar-11<br />
Non-Elective Admissions Subject to MRSA Screen<br />
Screening Target<br />
Page 9
9<br />
Health Improvement - Stroke<br />
Current Month:<br />
February 2011<br />
Target: by the end of 2010-11: 80% of people with stroke spend at least 90%<br />
of their time on a stroke unit<br />
Patients who spend at least<br />
90% of their time on a<br />
stroke unit<br />
Mar-10<br />
Apr-10<br />
May-10<br />
Jun-10<br />
Jul-10<br />
Aug-10<br />
Sep-10<br />
24 38 35 43 38 40 44 51 53 44 35 38 459<br />
Oct-10<br />
Nov-10<br />
Dec-10<br />
Jan-11<br />
Feb-11<br />
Mar-11<br />
2010/11<br />
YTD<br />
Number of people who were<br />
admitted to hospital<br />
following a stroke<br />
44 53 56 61 56 66 67 65 71 69 53 54 671<br />
%age of people spending at<br />
least 90% of their time on a<br />
stroke unit<br />
55% 72% 63% 70% 68% 61% 66% 78% 75% 64% 66% 70% 68%<br />
Month is based on Discharge Date<br />
90%<br />
80%<br />
70%<br />
60%<br />
50%<br />
40%<br />
30%<br />
20%<br />
10%<br />
0%<br />
%age spending at least 90% of their time on a Stroke Unit<br />
Mar-10<br />
Apr-10<br />
May-10<br />
Jun-10<br />
Jul-10<br />
Aug-10<br />
Sep-10<br />
Oct-10<br />
Nov-10<br />
Dec-10<br />
Jan-11<br />
Feb-11<br />
Mar-11<br />
Page 10
7<br />
Stroke Indicators<br />
Current Month:<br />
February 2011<br />
CQUIN Target: Percentage of Stroke patients having CT within 12 Hours of<br />
Admission<br />
No of patient having CT<br />
within 12 Hours of<br />
Admission<br />
Apr-10<br />
May-10<br />
Jun-10<br />
Jul-10<br />
Aug-10<br />
Sep-10<br />
Oct-10<br />
Nov-10<br />
Dec-10<br />
Jan-11<br />
Feb-11<br />
Mar-11<br />
2010/11<br />
YTD<br />
31 59 50 46 59 49 57 54 50 45 47 547<br />
Number of people who<br />
were admitted to hospital<br />
following a stroke (Excludes<br />
those having pre admission<br />
CT)<br />
%age of patient having CT<br />
within 12 Hours of<br />
Admission<br />
43 68 58 63 82 64 77 70 74 68 61 728<br />
72% 87% 86% 73% 72% 77% 74% 77% 68% 66% 77% 75%<br />
100%<br />
90%<br />
80%<br />
70%<br />
60%<br />
50%<br />
40%<br />
30%<br />
20%<br />
10%<br />
0%<br />
Percentage of Stroke Patients receiving CT within 12 Hours of Admission<br />
Please note percentages may change due to ongoing data collection<br />
9<br />
Current Month:<br />
Apr-10<br />
May-10<br />
Jun-10<br />
Jul-10<br />
Aug-10<br />
Sep-10<br />
Oct-10<br />
Nov-10<br />
Dec-10<br />
Jan-11<br />
Feb-11<br />
Mar-11<br />
2010/11<br />
YTD<br />
Apr-10<br />
May-10<br />
Jun-10<br />
Jul-10<br />
Aug-10<br />
Sep-10<br />
Oct-10<br />
Nov-10<br />
Dec-10<br />
Jan-11<br />
Feb-11<br />
Mar-11<br />
Stroke Indicators<br />
February 2011<br />
CQUIN Target: Percentage of Stroke patients having CT within 24 Hours of<br />
Admission<br />
No of patient having CT<br />
with 24 Hours of Admission<br />
42 65 55 51 66 56 64 60 57 51 53 620<br />
Number of people who<br />
were admitted to hospital<br />
following a stroke (Excludes<br />
those having pre admission<br />
CT)<br />
43 68 58 63 82 64 77 70 74 68 61 728<br />
%age of patient having CT<br />
with 24 Hours of Admission<br />
98% 96% 95% 81% 80% 88% 83% 86% 77% 75% 87% 85%<br />
100%<br />
90%<br />
80%<br />
70%<br />
60%<br />
50%<br />
40%<br />
30%<br />
20%<br />
10%<br />
0%<br />
Percentage of Stroke Patients receiving CT within 24 Hours of Admission<br />
Apr-10<br />
May-10<br />
Jun-10<br />
Jul-10<br />
Aug-10<br />
Sep-10<br />
Oct-10<br />
Nov-10<br />
Dec-10<br />
Jan-11<br />
Feb-11<br />
Mar-11<br />
Please note percentages may change due to ongoing data collection<br />
Page 11
7<br />
Stroke Indicators<br />
Current Month:<br />
February 2011<br />
Percentage of Stroke patients having 1st Swallow Screening within 24<br />
Hours of Admission<br />
Apr-10<br />
May-10<br />
Jun-10<br />
Jul-10<br />
Aug-10<br />
Sep-10<br />
Oct-10<br />
Nov-10<br />
Dec-10<br />
Jan-11<br />
Feb-11<br />
Mar-11<br />
2010/11<br />
YTD<br />
No of patient having 1st<br />
Swallow Screening within<br />
24 Hours of Admission<br />
41 66 49 53 66 58 68 58 60 57 49 625<br />
Number of people who<br />
were admitted to hospital<br />
following a stroke<br />
%age of patient having CT<br />
within 12 Hours of<br />
Admission<br />
43 68 58 63 82 64 77 70 74 68 61 728<br />
95% 97% 84% 84% 80% 91% 88% 83% 81% 84% 80% 86%<br />
100%<br />
90%<br />
80%<br />
70%<br />
60%<br />
50%<br />
40%<br />
30%<br />
20%<br />
10%<br />
0%<br />
Percentage of Stroke patients having 1st Swallow Screening within 24 Hours of Admission<br />
Apr-10<br />
May-10<br />
Jun-10<br />
Jul-10<br />
Aug-10<br />
Sep-10<br />
Oct-10<br />
Nov-10<br />
Dec-10<br />
Jan-11<br />
Feb-11<br />
Mar-11<br />
% within 24hrs Target %<br />
Please note percentages may change due to ongoing data collection<br />
9<br />
Stroke Indicators<br />
Current Month:<br />
February 2011<br />
Percentage of Stroke patients having SLT specialist assessment within 72<br />
Hours of Admission<br />
No of patient having SLT<br />
Spec assessment within 72<br />
hours of adm<br />
Apr-10<br />
May-10<br />
Jun-10<br />
Jul-10<br />
Aug-10<br />
Sep-10<br />
Oct-10<br />
Nov-10<br />
Dec-10<br />
Jan-11<br />
Feb-11<br />
Mar-11<br />
2010/11<br />
YTD<br />
21 31 15 18 30 18 20 15 18 13 24 223<br />
Number of patients Eligible<br />
for a SLT assessment<br />
following a stroke<br />
%age of patient having SLT<br />
Spec assessment within 72<br />
hours of adm<br />
27 42 36 35 48 49 32 38 48 40 31 426<br />
78% 74% 42% 51% 63% 37% 63% 39% 38% 33% 77% 52%<br />
Percentage of Stroke patients having SLT specialist assessment within 72 Hours of Admission<br />
100%<br />
90%<br />
80%<br />
70%<br />
60%<br />
50%<br />
40%<br />
30%<br />
20%<br />
10%<br />
0%<br />
Apr-10<br />
May-10<br />
Jun-10<br />
Jul-10<br />
Aug-10<br />
Sep-10<br />
Oct-10<br />
Nov-10<br />
Dec-10<br />
Jan-11<br />
Feb-11<br />
Mar-11<br />
% within 72hrs Target %<br />
Please note percentages may change due to ongoing data collection<br />
Page 12
QUALITY OBJECTIVE<br />
PERFORMANCE REPORT<br />
Page 13
11<br />
Consultant Outpatient Waiting List & Related Activity<br />
Current Month : February 2011<br />
12000<br />
11000<br />
10000<br />
9000<br />
8000<br />
7000<br />
6000<br />
5000<br />
4000<br />
TOTAL NEW OUTPATIENT WAITING LIST<br />
Apr-08<br />
May-<br />
Jun-08<br />
Jul-08<br />
Aug-08<br />
Sep-08<br />
Oct-08<br />
Nov-08<br />
Dec-08<br />
Jan-09<br />
Feb-09<br />
Mar-09<br />
Apr-09<br />
May-<br />
Jun-09<br />
Jul-09<br />
Aug-09<br />
Sep-09<br />
Oct-09<br />
Nov-09<br />
Dec-09<br />
Jan-10<br />
Feb-10<br />
Mar-10<br />
Apr-10<br />
May-<br />
Jun-10<br />
Jul-10<br />
Aug-10<br />
Sep-10<br />
Oct-10<br />
Nov-10<br />
Dec-10<br />
Jan-11<br />
Feb-11<br />
Mar-11<br />
12000<br />
11500<br />
11000<br />
10500<br />
10000<br />
9500<br />
9000<br />
8500<br />
8000<br />
7500<br />
7000<br />
Referrals Received<br />
Apr-08<br />
May-<br />
Jun-08<br />
Jul-08<br />
Aug-08<br />
Sep-08<br />
Oct-08<br />
Nov-08<br />
Dec-08<br />
Jan-09<br />
Feb-09<br />
Mar-09<br />
Apr-09<br />
May-<br />
Jun-09<br />
Jul-09<br />
Aug-09<br />
Sep-09<br />
Oct-09<br />
Nov-09<br />
Dec-09<br />
Jan-10<br />
Feb-10<br />
Mar-10<br />
Apr-10<br />
May-<br />
Jun-10<br />
Jul-10<br />
Aug-10<br />
Sep-10<br />
Oct-10<br />
Nov-10<br />
Dec-10<br />
Jan-11<br />
Feb-11<br />
Mar-11<br />
11500<br />
11000<br />
10500<br />
10000<br />
9500<br />
9000<br />
8500<br />
8000<br />
7500<br />
7000<br />
New Seen<br />
Apr-08<br />
May-<br />
Jun-08<br />
Jul-08<br />
Aug-08<br />
Sep-08<br />
Oct-08<br />
Nov-08<br />
Dec-08<br />
Jan-09<br />
Feb-09<br />
Mar-09<br />
Apr-09<br />
May-<br />
Jun-09<br />
Jul-09<br />
Aug-09<br />
Sep-09<br />
Oct-09<br />
Nov-09<br />
Dec-09<br />
Jan-10<br />
Feb-10<br />
Mar-10<br />
Apr-10<br />
May-<br />
Jun-10<br />
Jul-10<br />
Aug-10<br />
Sep-10<br />
Oct-10<br />
Nov-10<br />
Dec-10<br />
Jan-11<br />
Feb-11<br />
Mar-11<br />
Page 14
Consultant Outpatients Waiting & Related Activity - variances from planned levels<br />
Current Month :<br />
February 2011<br />
VARIANCES (Actual against Plan)<br />
Referrals New Activity ROTTs Total List size<br />
SPECIALTY No. % No. % No. % No. %<br />
General Surgery 200 9.7% (145) (7.6%) (41) (21.0%) 8 6.7%<br />
Vascular Surgery 239 16.0% (77) (6.0%) (38) (34.2%) 83 55.0%<br />
Hepatobiliary & Pancreatic Surgery 0 0.0% 0 0.0% 0 0.0% 0 0.0%<br />
Urology 499 11.6% (94) (2.5%) (20) (5.5%) 192 37.1%<br />
Nephrology 224 24.4% (213) (24.1%) (2) (4.1%) 13 18.6%<br />
ENT 368 4.4% (143) (1.9%) (177) (29.4%) 22 3.0%<br />
Audiological Medicine 0 0.0% 0 0.0% 0 0.0% 0 0.0%<br />
Plastic Surgery (403) (13.1%) 334 12.6% (51) (19.5%) 20 10.9%<br />
Plastic Surgery Hands (128) (14.3%) (97) (10.0%) 14 20.0% 5 11.4%<br />
Dermatology (55) (0.9%) 279 6.2% (112) (26.1%) 123 23.4%<br />
Oral Surgery 132 2.3% (95) (2.2%) (8) (0.6%) (103) (19.8%)<br />
Orthodontics 29 2.9% (43) (4.8%) 31 34.4% 26 19.5%<br />
Rest Dent 45 8.8% (9) (2.0%) (15) (30.0%) (24) (80.0%)<br />
Neurosurgery 76 2.0% (397) (13.6%) 13 1.2% (261) (88.2%)<br />
Neurology 401 10.8% (477) (14.6%) (132) (32.2%) 25 6.4%<br />
Neurophysiology 2 18.2% 0 0.0% 0 0.0% 0 0.0%<br />
Neuropsychology 0 0.0% 0 0.0% 0 0.0% 0 0.0%<br />
Ophthalmology (172) (1.8%) 396 4.9% (68) (10.0%) 217 24.5%<br />
Optician 0 0.0% 0 0.0% 0 0.0% 0 0.0%<br />
Orthoptist 0 0.0% 0 0.0% 0 0.0% 0 0.0%<br />
Orthopaedics 287 3.3% (247) (3.1%) (196) (25.1%) (161) (22.4%)<br />
Trauma 11 0.2% (129) (2.7%) 272 394.2% 0 0.0%<br />
Rheumatology 117 5.5% (28) (1.5%) (29) (17.4%) 31 9.7%<br />
Chronic Pain 373 17.1% (493) (25.4%) 12 4.8% (23) (7.6%)<br />
Acute Medicine 0 0.0% 0 0.0% 0 0.0% 0 0.0%<br />
Intensive Care (40) 0.0% 44 0.0% 0 0.0% 0 0.0%<br />
Gynaecology (584) (15.7%) 899 33.1% (197) (53.4%) (41) (15.5%)<br />
Gynaecological Oncology 256 41.5% (782) (60.7%) 5 15.6% 45 81.8%<br />
Uro-Infertility 112 21.1% (65) (15.3%) (18) (28.1%) 21 42.9%<br />
Uro-Gynaecology (89) (10.6%) 8 0.9% (10) (21.7%) (3) (2.9%)<br />
Gynae - Colposcopy Suite 209 17.5% (179) (16.2%) (17) (20.2%) 66 61.1%<br />
Gynae - Hysteroscopy (126) (29.3%) 141 31.5% (4) (12.1%) (32) (145.5%)<br />
Breast Surgery 253 8.9% (266) (9.8%) (6) (5.1%) 23 34.8%<br />
PAC (43) (3.2%) 63 5.5% (22) (10.3%) 53 80.3%<br />
Obstetrics (514) (19.1%) 528 23.1% (17) (4.3%) 8 16.3%<br />
GUM 0 0.0% (936) (8.2%) 0 0.0% 0 0.0%<br />
Paediatrics (291) (9.7%) 311 11.6% (36) (12.5%) 93 31.6%<br />
Neonatology (38) (13.7%) 24 8.7% 9 52.9% 1 2.7%<br />
Community Paediatrics 57 20.6% (59) (24.7%) (34) (64.2%) (19) (105.6%)<br />
Child Psychology 0 0.0% 0 0.0% 0 0.0% 0 0.0%<br />
Cardiac Surgery (41) (7.6%) (4) (0.7%) 8 14.8% (17) (41.5%)<br />
Cardiology 534 12.6% (347) (9.0%) (165) (38.2%) 147 42.6%<br />
Thoracic Surgery (6) (2.1%) (11) (5.1%) 8 50.0% 12 70.6%<br />
A&E 283 8.5% (323) (12.1%) (19) (86.4%) 23 24.7%<br />
Clinical Oncology 47 3.1% 42 3.0% 28 28.0% 15 12.7%<br />
Medical Oncology 35 25.2% (11) (8.9%) (8) (53.3%) (2) (33.3%)<br />
Palliative Medicine 20 9.2% (44) (25.3%) 11 17.2% (10) (142.9%)<br />
Clin Haematology 54 2.7% (59) (7.0%) 13 13.7% 29 29.0%<br />
Clin Immunology (106) (11.4%) (27) (4.7%) 353 212.7% 60 30.8%<br />
Diabetic Medicine (26) (3.5%) 6 0.9% (4) (5.6%) (42) (102.4%)<br />
Endocrinology 3 0.4% (53) (8.2%) (7) (15.6%) (51) (96.2%)<br />
General Medicine 65 38.7% (58) (36.5%) (26) (57.8%) 14 82.4%<br />
HCE 40 6.9% 95 18.4% 148 164.4% (42) (43.8%)<br />
Thoracic Medicine (32) (1.4%) (53) (2.5%) 4 1.6% (28) (12.3%)<br />
Gastroenterology 374 12.3% (15) (0.6%) (3) (1.2%) 95 23.9%<br />
Hepatology (149) (23.8%) 88 15.5% 3 7.1% (32) (266.7%)<br />
Colorectal Surgery (648) (17.2%) 1097 37.4% 87 25.5% 82 20.3%<br />
Upper GI Surgery (446) (24.7%) 106 6.2% 6 5.6% 4 3.6%<br />
Endoscopy 0 0.0% 0 0.0% 0 0.0% 0 0.0%<br />
Clin Chemistry 20 11.9% 14 10.3% (7) (35.0%) 18 64.3%<br />
Neuroradiology 12 60.0% 1 0.0% 0 0.0% 0 0.0%<br />
Neuropathology 0 0.0% 0 0.0% 0 0.0% 0 0.0%<br />
Nuclear Medicine 18 11.3% (21) (13.7%) 5 71.4% 2 22.2%<br />
Radiology 0 0.0% 0 0.0% 0 0.0% 0 0.0%<br />
TOTAL 1458 1.3% (1524) (1.4%) (459) (4.2%) 685 7.2%<br />
Page 15
11<br />
Inpatient & Day Case Waiting List & Related Activity<br />
Current Month : February 2011<br />
8000<br />
7500<br />
7000<br />
6500<br />
6000<br />
5500<br />
5000<br />
4500<br />
4000<br />
3500<br />
IP & DC Total WL Size<br />
Apr-08<br />
May-08<br />
Jun-08<br />
Jul-08<br />
Aug-08<br />
Sep-08<br />
Oct-08<br />
Nov-08<br />
Dec-08<br />
Jan-09<br />
Feb-09<br />
Mar-09<br />
Apr-09<br />
May-09<br />
Jun-09<br />
Jul-09<br />
Aug-09<br />
Sep-09<br />
Oct-09<br />
Nov-09<br />
Dec-09<br />
Jan-10<br />
Feb-10<br />
Mar-10<br />
Apr-10<br />
May-10<br />
Jun-10<br />
Jul-10<br />
Aug-10<br />
Sep-10<br />
Oct-10<br />
Nov-10<br />
Dec-10<br />
Jan-11<br />
Feb-11<br />
Mar-11<br />
5500<br />
5300<br />
5100<br />
4900<br />
4700<br />
4500<br />
4300<br />
4100<br />
3900<br />
3700<br />
Elective Inpatient & Day Case FFCEs<br />
Apr-08<br />
May-<br />
Jun-08<br />
Jul-08<br />
Aug-08<br />
Sep-08<br />
Oct-08<br />
Nov-08<br />
Dec-08<br />
Jan-09<br />
Feb-09<br />
Mar-09<br />
Apr-09<br />
May-<br />
Jun-09<br />
Jul-09<br />
Aug-09<br />
Sep-09<br />
Oct-09<br />
Nov-09<br />
Dec-09<br />
Jan-10<br />
Feb-10<br />
Mar-10<br />
Apr-10<br />
May-<br />
Jun-10<br />
Jul-10<br />
Aug-10<br />
Sep-10<br />
Oct-10<br />
Nov-10<br />
Dec-10<br />
Jan-11<br />
Feb-11<br />
Mar-11<br />
5500<br />
Additions to WL<br />
5000<br />
4500<br />
4000<br />
3500<br />
3000<br />
Apr-08<br />
May-08<br />
Jun-08<br />
Jul-08<br />
Aug-08<br />
Sep-08<br />
Oct-08<br />
Nov-08<br />
Dec-08<br />
Jan-09<br />
Feb-09<br />
Mar-09<br />
Apr-09<br />
May-09<br />
Jun-09<br />
Jul-09<br />
Aug-09<br />
Sep-09<br />
Oct-09<br />
Nov-09<br />
Dec-09<br />
Jan-10<br />
Feb-10<br />
Mar-10<br />
Apr-10<br />
May-10<br />
Jun-10<br />
Jul-10<br />
Aug-10<br />
Sep-10<br />
Oct-10<br />
Nov-10<br />
Dec-10<br />
Jan-11<br />
Feb-11<br />
Mar-11<br />
Page 16
Current Month : February 2011<br />
Inpatient & Day Case Waiting List & Related Activity - variances from planned levels<br />
VARIANCES : ACTUAL AGAINST PLAN<br />
Additions FFCEs ROTTs Total List size<br />
SPECIALTY No. % No. % No. % No. %<br />
General Surgery 77 4.8% (173) (11.8%) 14 7.5% (118) (48.2%)<br />
Vascular Surgery 9 1.1% (11) (1.3%) 35 38.0% (13) (12.4%)<br />
Hepatobiliary & Pancreatic Surgery 0 0.0% 0 0.0% 0 0.0% 0 0.0%<br />
Urology 79 2.2% (137) (3.0%) 26 9.6% (63) (26.1%)<br />
Nephrology 133 29.6% (174) (17.6%) (6) (16.2%) 8 20.5%<br />
ENT 80 3.4% (103) (4.5%) 44 19.6% (18) (4.5%)<br />
Audiological Medicine 0 0.0% 0 0.0% 0 0.0% 0 0.0%<br />
Plastic Surgery (202) (5.0%) (153) (3.9%) 65 17.5% (212) (44.3%)<br />
Plastic Surgery Hands 10 40.0% (34) (50.0%) 1 0.0% 0 0.0%<br />
Dermatology (122) (6.1%) 187 9.7% 89 61.8% 35 14.6%<br />
Oral Surgery 104 6.8% (44) (3.1%) (17) (12.1%) (28) (14.4%)<br />
Orthodontics 4 4.5% 5 5.8% 1 33.3% 4 18.2%<br />
Rest Dent (10) (13.0%) (3) (4.3%) 7 87.5% (12) (150.0%)<br />
Neurosurgery (43) (2.7%) 75 5.3% 10 3.9% (26) (12.3%)<br />
Neurology (33) (7.0%) (61) (8.3%) 46 63.0% 14 16.1%<br />
Neurophysiology 41 87.2% (25) (80.6%) (16) (94.1%) 1 100.0%<br />
Neuropsychology 0 0.0% 0 0.0% 0 0.0% 0 0.0%<br />
Ophthalmology (396) (7.1%) 189 3.6% 20 3.9% (251) (31.2%)<br />
Optician 0 0.0% 0 0.0% 0 0.0% 0 0.0%<br />
Orthoptist 0 0.0% 0 0.0% 0 0.0% 0 0.0%<br />
Orthopaedics 68 1.2% 223 4.6% (138) (11.9%) (60) (7.2%)<br />
Trauma 0 0.0% 0 0.0% 0 0.0% 0 0.0%<br />
Rheumatology 15 10.6% (7) (1.3%) (17) (68.0%) (9) (450.0%)<br />
Chronic Pain 290 43.2% (309) (41.0%) (37) (32.5%) 15 46.9%<br />
Intensive Care 0 0.0% (1) (100.0%) 0 0.0% 0 0.0%<br />
Gynaecology 186 8.2% (202) (10.0%) (61) (20.7%) (97) (30.5%)<br />
Gynaecological Oncology (8) (5.4%) 10 7.1% 3 37.5% (7) (100.0%)<br />
Uro-Infertility (2) 0.0% 2 0.0% 0 0.0% 0 0.0%<br />
Uro-Gynaecology 0 0.0% 2 200.0% 0 0.0% 0 0.0%<br />
Gynae - Colposcopy Suite 0 0.0% 0 0.0% 0 0.0% 0 0.0%<br />
Gynae - Hysteroscopy 0 0.0% (1) (100.0%) 1 0.0% 0 0.0%<br />
Breast Surgery 29 4.0% (6) (0.9%) (9) (18.0%) 1 2.5%<br />
PAC (118) (11.5%) 106 11.3% 15 16.9% 23 67.6%<br />
Obstetrics 0 0.0% 0 0.0% 0 0.0% 0 0.0%<br />
GUM 0 0.0% 0 0.0% 0 0.0% 0 0.0%<br />
Paediatrics (20) (5.0%) 9 1.7% 5 15.2% (6) (54.5%)<br />
Neonatology 1 9.1% 3 12.5% (2) (66.7%) 0 0.0%<br />
Community Paediatrics 0 0.0% (1) (100.0%) 0 0.0% 0 0.0%<br />
Child Psychology 0 0.0% 0 0.0% 0 0.0% 0 0.0%<br />
Cardiac Surgery 4 0.4% (35) (4.3%) (31) (16.4%) (96) (69.1%)<br />
Cardiology (127) (6.1%) 82 3.8% 19 8.4% (64) (34.6%)<br />
Thoracic Surgery 46 7.6% (12) (2.1%) (36) (51.4%) (1) (5.0%)<br />
A&E 0 0.0% 0 0.0% 0 0.0% 0 0.0%<br />
Acute Medicine 0 0.0% 17 0.0% 0 0.0% 0 0.0%<br />
Clinical Oncology (671) (13.5%) 452 8.5% 60 14.7% (26) (11.4%)<br />
Medical Oncology 4 1.3% 1 0.3% (7) (18.4%) (5) (35.7%)<br />
Palliative Medicine 0 0.0% 4 400.0% 0 0.0% 0 0.0%<br />
Clin Haematology (28) (127.3%) 43 1.9% 4 133.3% (5) 0.0%<br />
Clin Immunology (9) 0.0% 0 0.0% 0 0.0% (2) 0.0%<br />
Diabetic Medicine 0 0.0% 292 0.0% (1) (100.0%) 0 0.0%<br />
Endocrinology (123) (150.0%) (242) (80.9%) 7 77.8% (13) (216.7%)<br />
General Medicine 1 4.5% (98) (100.0%) 3 300.0% 0 0.0%<br />
HCE (17) (23.0%) 10 27.8% (30) (62.5%) 1 100.0%<br />
Thoracic Medicine (48) (11.3%) 32 6.3% 5 12.8% (17) (188.9%)<br />
Gastroenterology (91) (44.2%) 10 1.6% 6 15.4% (14) (200.0%)<br />
Hepatology (152) (163.4%) 66 14.3% 23 1150.0% (12) (150.0%)<br />
Colorectal Surgery 135 7.9% (93) (6.1%) 24 8.9% 1 0.4%<br />
Upper GI Surgery (159) (10.5%) (77) (5.4%) 18 10.2% (214) (78.4%)<br />
Endoscopy 2 28.6% 0 0.0% 0 0.0% 0 0.0%<br />
Clin Chemistry 1 100.0% (1) (100.0%) 0 0.0% 0 0.0%<br />
Neuroradiology (28) (186.7%) 7 18.4% 6 0.0% 2 66.7%<br />
Neuropathology (11) (14.5%) 15 25.0% (5) (23.8%) 0 0.0%<br />
Nuclear Medicine (1) 0.0% 0 0.0% 0 0.0% 0 0.0%<br />
Radiology 9 32.1% (19) (61.3%) 2 0.0% (2) (100.0%)<br />
TOTAL (1091) (2.3%) (180) (0.3%) 146 2.6% (1286) (23.4%)<br />
Page 17
11<br />
Referral To Treatment (RTT) Times - 18 weeks monitoring<br />
RTT for Admitted Patients<br />
Current Month:<br />
February 2011<br />
Target = To Achieve Max 18 wks wait for 90% of Admitted Patients<br />
on RTT Pathways by Dec 2008<br />
Mar-10 Apr-10 May-10 Jun-10 Jul-10 Aug-10 Sep-10 Oct-10 Nov-10 Dec-10 Jan-11 Feb-11 Mar-11<br />
Treated within 18 weeks 3411 2809 2733 3257 3039 3094 3321 3186 3393 2828 2948 2946<br />
Treated after 18 weeks 211 151 70 91 126 98 112 116 150 112 227 253<br />
% Treated within 18 weeks 94.2% 94.9% 97.5% 97.3% 96.0% 96.9% 96.7% 96.5% 95.8% 96.2% 92.9% 92.1%<br />
DoH target 90.0% 90.0% 90.0% 90.0% 90.0% 90.0% 90.0% 90.0% 90.0% 90.0% 90.0% 90.0% 90.0%<br />
100%<br />
95%<br />
90%<br />
85%<br />
80%<br />
75%<br />
70%<br />
% Admitted Patients Treated within 18 weeks<br />
Apr-08<br />
May-08<br />
Jun-08<br />
Jul-08<br />
Aug-08<br />
Sep-08<br />
Oct-08<br />
Nov-08<br />
Dec-08<br />
Jan-09<br />
Feb-09<br />
Mar-09<br />
Apr-09<br />
May-09<br />
Jun-09<br />
Jul-09<br />
Aug-09<br />
Sep-09<br />
Oct-09<br />
Nov-09<br />
Dec-09<br />
Jan-10<br />
Feb-10<br />
Mar-10<br />
Apr-10<br />
May-10<br />
Jun-10<br />
Jul-10<br />
Aug-10<br />
Sep-10<br />
Oct-10<br />
Nov-10<br />
Dec-10<br />
Jan-11<br />
Feb-11<br />
Mar-11<br />
SPECIALTY<br />
Current Month<br />
Target<br />
Of which are<br />
Mar-10<br />
NHS<br />
Adms < 18<br />
Constitution<br />
wks Adms 18+ wks Breaches % < 18 wks<br />
Anaesthestics & Theatres<br />
AN Chronic Pain 94% 17<br />
0<br />
0 100.0% 90%<br />
IC Intensive Care<br />
Cardiothoracics<br />
CS Cardiac Surgery 100%<br />
0<br />
64<br />
0<br />
2<br />
0<br />
1<br />
97.0% 90%<br />
CD Cardiology 99% 76<br />
2<br />
1<br />
97.4% 90%<br />
TS Thoracic Surgery 100% 32<br />
0<br />
0 100.0% 90%<br />
VS Vascular Surgery 89% 57<br />
1<br />
0<br />
98.3% 90%<br />
Children's Services<br />
PD Paediatrics 100% 16<br />
0<br />
0 100.0% 90%<br />
CMChild Psychology<br />
Emergency Services<br />
AE A&E<br />
Gastroenterology, Surgery & Renal Services<br />
GA Gastroenterology 100%<br />
0<br />
0<br />
11<br />
0<br />
0<br />
0<br />
0<br />
0<br />
0 100.0% 90%<br />
HP Hepatology 100% 22<br />
0<br />
0 100.0% 90%<br />
ed Endoscopy 0<br />
0<br />
0<br />
90%<br />
CO Colorectal Surgery 92% 91<br />
10<br />
7<br />
90.1% 90%<br />
UG Upper GI Surgery 79% 97<br />
30<br />
22 76.4% 90%<br />
ED Endoscopy<br />
GS General Surgery 99%<br />
0<br />
59<br />
0<br />
34<br />
0<br />
18 63.4% 90%<br />
UR Urology 92% 114<br />
26<br />
23 81.4% 90%<br />
NF Nephrology 100% 17<br />
0<br />
0 100.0% 90%<br />
Haematology & Oncology<br />
RT Clinical Oncology 100% 451<br />
1<br />
1<br />
99.8% 90%<br />
MOMedical Oncology 100% 24<br />
0<br />
0 100.0% 90%<br />
PT Palliative Medicine 0<br />
0<br />
0<br />
90%<br />
HMClin Haematology 4<br />
0<br />
0 100.0% 90%<br />
CI Clin Immunology 0<br />
0<br />
0<br />
90%<br />
Head & Neck Surgery<br />
ET ENT 94% 128<br />
7<br />
7<br />
94.8% 90%<br />
AU Audiological Medicine 0<br />
0<br />
0<br />
90%<br />
PL Plastic Surgery 94% 273<br />
34<br />
30 88.9% 90%<br />
OS Oral Surgery 96% 103<br />
1<br />
0<br />
99.0% 90%<br />
OD Orthodontics 100% 13<br />
0<br />
0 100.0% 90%<br />
RD Rest Dent 100% 5<br />
0<br />
0 100.0% 90%<br />
DMDermatology 96% 125<br />
21<br />
15 85.6% 90%<br />
Imaging<br />
NR Neuroradiology 100% 0<br />
0<br />
0<br />
90%<br />
NMNuclear Medicine 0<br />
0<br />
0<br />
90%<br />
RA Radiology 100% 1<br />
0<br />
0 100.0% 90%<br />
Medical Specialties<br />
DI Diabetic Medicine 0<br />
0<br />
0<br />
90%<br />
EN Endocrinology 2<br />
0<br />
0 100.0% 90%<br />
GMGeneral Medicine 100% 0<br />
0<br />
0<br />
90%<br />
HE HCE 1<br />
0<br />
0 100.0% 90%<br />
TM Thoracic Medicine 100% 3<br />
0<br />
0 100.0% 90%<br />
Neurosciences<br />
NS Neurosurgery 85% 79<br />
8<br />
7<br />
90.8% 90%<br />
NL Neurology 100% 21<br />
1<br />
1<br />
95.5% 90%<br />
NP Neurophysiology 0<br />
0<br />
0<br />
90%<br />
Ophthalmology<br />
OP Ophthalmology 93% 433<br />
31<br />
17 93.3% 90%<br />
Pathology & SDU<br />
CC Clin Chemistry 0<br />
0<br />
0<br />
90%<br />
NY Neuropathology 0<br />
0<br />
0<br />
90%<br />
Orthopaedics & Rheumatology<br />
OR Orthopaedics 92% 349<br />
9<br />
7<br />
97.5% 90%<br />
TR Trauma 0<br />
0<br />
0<br />
90%<br />
RH Rheumatology 100% 11<br />
0<br />
0 100.0% 90%<br />
Reproductive, Womens & Neonatal Services<br />
GY Gynaecology 88% 108<br />
34<br />
30 76.1% 90%<br />
BS Breast Surgery 100% 47<br />
1<br />
0<br />
97.9% 90%<br />
PA PAC 100% 91<br />
0<br />
0 100.0% 90%<br />
OB Obstetrics 0<br />
0<br />
0<br />
90%<br />
GU GUM 0<br />
0<br />
0<br />
90%<br />
NE Neonatology 1<br />
0<br />
0 100.0% 90%<br />
TT TOTAL 94% 2946 253<br />
187 92.1% 90%<br />
Page 18
11<br />
Referral To Treatment (RTT) Times - 18 weeks monitoring<br />
RTT for Non Admitted Patients<br />
Current Month:<br />
February 2011<br />
Target = To Achieve Max 18 wks wait for 95% of Non Admitted<br />
Patients on RTT Pathways by December 2008<br />
Mar-10 Apr-10 May-10 Jun-10 Jul-10 Aug-10 Sep-10 Oct-10 Nov-10 Dec-10 Jan-11 Feb-11 Mar-11<br />
Treated within 18 weeks 7305 6511 6196 6889 7125 6699 7319 6622 7274 5440 6267 5909<br />
Treated after 18 weeks 181 189 136 196 238 235 212 233 254 159 158 128<br />
% Treated within 18 weeks 97.6% 97.2% 97.2% 97.2% 97.2% 97.2% 97.2% 97.2% 97.2% 97.2% 97.5% 97.9%<br />
DOH Target 95.0% 95.0% 95.0% 95.0% 95.0% 95.0% 95.0% 95.0% 95.0% 95.0% 95.0% 95.0% 95.0%<br />
100%<br />
98%<br />
96%<br />
94%<br />
92%<br />
90%<br />
88%<br />
86%<br />
84%<br />
% Non Admitted Patients Treated within 18 weeks<br />
Apr-08<br />
May-08<br />
Jun-08<br />
Jul-08<br />
Aug-08<br />
Sep-08<br />
Oct-08<br />
Nov-08<br />
Dec-08<br />
Jan-09<br />
Feb-09<br />
Mar-09<br />
Apr-09<br />
May-09<br />
Jun-09<br />
Jul-09<br />
Aug-09<br />
Sep-09<br />
Oct-09<br />
Nov-09<br />
Dec-09<br />
Jan-10<br />
Feb-10<br />
Mar-10<br />
Apr-10<br />
May-10<br />
Jun-10<br />
Jul-10<br />
Aug-10<br />
Sep-10<br />
Oct-10<br />
Nov-10<br />
Dec-10<br />
Jan-11<br />
Feb-11<br />
Mar-11<br />
SPECIALTY<br />
Current Month<br />
Mar-10<br />
Of which are<br />
NHS<br />
Target<br />
Constitution<br />
Atts < 18 wks Atts 18+ wks Breaches % < 18 wks<br />
Anaesthestics & Theatres<br />
AN Chronic Pain 95% 69 8 5<br />
89.6% 95%<br />
IC Intensive Care 0 0<br />
0<br />
95%<br />
Cardiothoracics<br />
CS Cardiac Surgery 100% 4 0 0 100.0% 95%<br />
CD Cardiology 97% 153 0 0 100.0% 95%<br />
TS Thoracic Surgery 100% 7 0 0 100.0% 95%<br />
VS Vascular Surgery 100% 14 0 0 100.0% 95%<br />
Children's Services<br />
PD Paediatrics 99% 194 1 1<br />
99.5% 95%<br />
CMChild Psychology #N/A 1 0 0 100.0% 95%<br />
Emergency Services<br />
AE A&E 0 0<br />
0<br />
95%<br />
Gastroenterology, Surgery & Renal Services<br />
GA Gastroenterology 97% 143 7 7<br />
95.3% 95%<br />
HP Hepatology 95% 28 0 0 100.0% 95%<br />
ed Endoscopy 0 0<br />
0<br />
95%<br />
CO Colorectal Surgery 91% 179 14 9<br />
92.7% 95%<br />
UG Upper GI Surgery 98% 60 1 1<br />
98.4% 95%<br />
ED Endoscopy 0 0<br />
0<br />
95%<br />
GS General Surgery 97% 48 5 5<br />
90.6% 95%<br />
UR Urology 95% 135 2 0<br />
98.5% 95%<br />
NF Nephrology 100% 32 0 0 100.0% 95%<br />
Haematology & Oncology<br />
RT Clinical Oncology 100% 16 0 0 100.0% 95%<br />
MOMedical Oncology 100% 1 0 0 100.0% 95%<br />
PT Palliative Medicine 100% 10 0 0 100.0% 95%<br />
HMClin Haematology 99% 59 1 0<br />
98.3% 95%<br />
CI Clin Immunology 90% 49 4 2<br />
92.5% 95%<br />
Head & Neck Surgery<br />
ET ENT 98% 414 9 7<br />
97.9% 95%<br />
AU Audiological Medicine 0 0<br />
0<br />
95%<br />
PL Plastic Surgery 99% 195 9 3<br />
95.6% 95%<br />
OS Oral Surgery 98% 366 2 2<br />
99.5% 95%<br />
OD Orthodontics 100% 83 0 0 100.0% 95%<br />
RD Rest Dent 91% 38 2 1<br />
95.0% 95%<br />
DMDermatology 98% 257 3 1<br />
98.8% 95%<br />
Imaging<br />
NR Neuroradiology 1 0 0 100.0% 95%<br />
NMNuclear Medicine 100% 4 0 0 100.0% 95%<br />
RA Radiology 0 0<br />
0<br />
95%<br />
Medical Specialties<br />
DI Diabetic Medicine 100% 20 0 0 100.0% 95%<br />
EN Endocrinology 95% 37 0 0 100.0% 95%<br />
GMGeneral Medicine 100% 9 0 0 100.0% 95%<br />
HE HCE 100% 19 2 2<br />
90.5% 95%<br />
TM Thoracic Medicine 99% 128 0 0 100.0% 95%<br />
Neurosciences<br />
NS Neurosurgery 95% 162 12 10 93.1% 95%<br />
NL Neurology 97% 159 11 9<br />
93.5% 95%<br />
NX Neuropsychology 0 0<br />
0<br />
95%<br />
NP Neurophysiology 0 0<br />
0<br />
95%<br />
Ophthalmology<br />
OP Ophthalmology 96% 396 6 3<br />
98.5% 95%<br />
Pathology & SDU<br />
CC Clin Chemistry 100% 6 0 0 100.0% 95%<br />
NY Neuropathology 1 0 0 100.0% 95%<br />
Orthopaedics & Rheumatology<br />
OR Orthopaedics 96% 461 14 13 97.1% 95%<br />
TR Trauma 0 0<br />
0<br />
95%<br />
RH Rheumatology 99% 128 4 4<br />
97.0% 95%<br />
Reproductive, Womens & Neonatal Services<br />
GY Gynaecology 98% 330 11 4<br />
96.8% 95%<br />
BS Breast Surgery 100% 174 0 0 100.0% 95%<br />
PA PAC 100% 37 0 0 100.0% 95%<br />
OB Obstetrics 0 0<br />
0<br />
95%<br />
GU GUM 100% 1171 0 0 100.0% 95%<br />
NE Neonatology 100% 63 0 0 100.0% 95%<br />
TT TOTAL 97.6% 5909 128 89 97.9% 95%<br />
Page 19
11<br />
Referral To Treatment (RTT) Times - 18 weeks monitoring<br />
Admitted & Non-Admitted Clock Stops - Reportable Specialties<br />
Current Month:<br />
February 2011<br />
Target = 90% of Admitted Patients & 95% of<br />
Non Admitted Patients.<br />
Admitted Pathways<br />
Treated & Not Treated Clock Stops<br />
First Treatment Subsequent Treatment Total Clock<br />
Stops Within<br />
Unknown Within Breach Within Breach Target (DoH)<br />
General Surgery 0 200 56 151 20 82.2%<br />
Urology 0 55 19 59 7 81.4%<br />
Trauma & Orthopaedics 0 156 3 193 6 97.5%<br />
Ear, Nose & Throat (ENT) 0 52 2 76 5 94.8%<br />
Ophthalmology 0 155 19 278 12 93.3%<br />
Oral Surgery 0 79 1 24 0 99.0%<br />
Neurosurgery 0 39 5 40 3 90.8%<br />
Plastic Surgery 0 193 26 80 8 88.9%<br />
Cardiothoracic Surgery 0 27 1 69 1 98.0%<br />
General Medicine 0 0 0 0 0<br />
Gastroenterology 0 2 0 9 0 100.0%<br />
Cardiology 0 3 0 73 2 97.4%<br />
Dermatology 0 93 17 32 4 85.6%<br />
Thoracic Medicine 0 1 0 2 0 100.0%<br />
Neurology 0 7 1 14 0 95.5%<br />
Rheumatology 0 1 0 10 0 100.0%<br />
Geriatric Medicine 0 1 0 0 0 100.0%<br />
Gynaecology 0 162 17 37 17 85.4%<br />
Other 0 33 1 540 0 99.8%<br />
Total 0 1259 168 1687 85 92.1%<br />
Non-Admitted Pathways<br />
Treated & Not Treated Clock Stops<br />
First Treatment Subsequent Treatment Total Clock<br />
Stops Within<br />
Unknown Within Breach Within Breach Target (DoH)<br />
General Surgery 0 475 20 1 0 96.0%<br />
Urology 0 135 2 0 0 98.5%<br />
Trauma & Orthopaedics 0 461 14 0 0 97.1%<br />
Ear, Nose & Throat (ENT) 0 414 9 0 0 97.9%<br />
Ophthalmology 0 393 5 3 1 98.5%<br />
Oral Surgery 0 342 2 24 0 99.5%<br />
Neurosurgery 0 160 12 2 0 93.1%<br />
Plastic Surgery 0 194 9 1 0 95.6%<br />
Cardiothoracic Surgery 0 11 0 0 0 100.0%<br />
General Medicine 0 9 0 0 0 100.0%<br />
Gastroenterology 0 143 7 0 0 95.3%<br />
Cardiology 0 153 0 0 0 100.0%<br />
Dermatology 0 255 3 2 0 98.8%<br />
Thoracic Medicine 0 128 0 0 0 100.0%<br />
Neurology 0 160 11 0 0 93.6%<br />
Rheumatology 0 128 4 0 0 97.0%<br />
Geriatric Medicine 0 19 2 0 0 90.5%<br />
Gynaecology 0 386 11 1 0 97.2%<br />
Other 0 1905 16 4 0 99.2%<br />
Total 0 5871 127 38 1 97.9%<br />
Page 20
11<br />
Referral To Treatment (RTT) Times - 18 weeks monitoring<br />
RTT Backlogs<br />
Current Month:<br />
February 2011 Aspiration to Clear backlogs by end July 2010 in order to be 100%<br />
compliant with NHS Constitution<br />
Admitted Backlog i.e. Patients on IP/DC Waiting List for Treatment who have already breached 18 weeks<br />
Apr-10 May-10 Jun-10 Jul-10 Aug-10 Sep-10 Oct-10 Nov-10 Dec-10 Jan-11 Feb-11 Mar-11<br />
Admitted backlog size 298 277 293 307 304 400 512 618 715 665 580<br />
Plan 300 296 292 288 284 280 276 272 268 264 260 250<br />
800<br />
700<br />
600<br />
500<br />
400<br />
300<br />
200<br />
100<br />
0<br />
Admitted Pathway Backlog<br />
Apr-09<br />
May-09<br />
Jun-09<br />
Jul-09<br />
Aug-09<br />
Sep-09<br />
Oct-09<br />
Nov-09<br />
Dec-09<br />
Jan-10<br />
Feb-10<br />
Mar-10<br />
Apr-10<br />
May-10<br />
Jun-10<br />
Jul-10<br />
Aug-10<br />
Sep-10<br />
Oct-10<br />
Nov-10<br />
Dec-10<br />
Jan-11<br />
Feb-11<br />
Mar-11<br />
Actual<br />
Plan<br />
Non Admitted Backlog i.e. Patients on Follow Up Waiting List for Treatment who have already breached 18 weeks<br />
Apr-10 May-10 Jun-10 Jul-10 Aug-10 Sep-10 Oct-10 Nov-10 Dec-10 Jan-11 Feb-11 Mar-11<br />
Non Admitted backlog<br />
size<br />
845 601 395 307 345 336 332 186 220 255 269<br />
Plan 850 600 300 200 100 50 50 50 50 50 50 50<br />
Non Admitted Pathway Backlog<br />
900<br />
800<br />
700<br />
600<br />
500<br />
400<br />
300<br />
200<br />
100<br />
0<br />
Apr-10<br />
May-<br />
10<br />
Jun-10<br />
Jul-10<br />
Aug-<br />
10<br />
Sep-<br />
10<br />
Oct-10<br />
Nov-<br />
10<br />
Dec-<br />
10<br />
Jan-11<br />
Feb-11<br />
Mar-11<br />
Actual<br />
Plan<br />
No DTT Backlog i.e. Patients on an incomplete pathway not on a treatment WL who have already breached 18 weeks<br />
Apr-10 May-10 Jun-10 Jul-10 Aug-10 Sep-10 Oct-10 Nov-10 Dec-10 Jan-11 Feb-11 Mar-11<br />
No DTT backlog size 750 604 541 699 452 449 368 296 340 323 301<br />
Plan 750 600 500 400 300 200 100 100 100 100 100 100<br />
900<br />
800<br />
700<br />
600<br />
500<br />
400<br />
300<br />
200<br />
100<br />
0<br />
DTT (Decision To Treat) Backlog<br />
Mar-10<br />
Apr-10<br />
May-10<br />
Jun-10<br />
Jul-10<br />
Aug-10<br />
Sep-10<br />
Oct-10<br />
Nov-10<br />
Dec-10<br />
Jan-11<br />
Feb-11<br />
Mar-11<br />
Actual<br />
Plan<br />
Page 21
11<br />
Referral To Treatment (RTT) Times<br />
Median Waits<br />
Current Month:<br />
February 2011<br />
Admitted Pathways - Median Waits (weeks)<br />
Apr-10 May-10 Jun-10 Jul-10 Aug-10 Sep-10 Oct-10 Nov-10 Dec-10 Jan-11 Feb-11 Mar-11<br />
PHNT 7.2 6.7 6.9 6.8 7.6 7.8 8.2 8.1 7.4 9.2 9.0<br />
NHS South West 7.5 8.5 7.6 7.7 7.8 7.9 8.1 7.8 7.2 8.5<br />
DoH Threshold 11.1 11.1 11.1 11.1 11.1 11.1 11.1 11.1 11.1 11.1 11.1 11.1<br />
Weeks<br />
12<br />
10<br />
8<br />
6<br />
4<br />
2<br />
0<br />
Admitted Pathways - Median Waits<br />
Apr-10<br />
May-10<br />
Jun-10<br />
Jul-10<br />
Aug-10<br />
Sep-10<br />
Oct-10<br />
Nov-10<br />
Dec-10<br />
Jan-11<br />
Feb-11<br />
Mar-11<br />
PHNT NHS South West DoH Threshold<br />
Non Admitted Pathways - Median Waits (weeks)<br />
Apr-10 May-10 Jun-10 Jul-10 Aug-10 Sep-10 Oct-10 Nov-10 Dec-10 Jan-11 Feb-11 Mar-11<br />
PHNT 2.5 3.5 3.5 3.7 3.7 4.0 3.6 3.8 3.1 4.0 2.5<br />
NHS South West 4.5 4.5 4.2 4.2 4.4 4.6 3.6 4.3 4.0 4.9<br />
DoH Threshold 6.6 6.6 6.6 6.6 6.6 6.6 6.6 6.6 6.6 6.6 6.6 6.6<br />
Non Admitted Pathways - Median waits<br />
Weeks<br />
7<br />
6<br />
5<br />
4<br />
3<br />
2<br />
1<br />
0<br />
Apr-10<br />
May-10<br />
Jun-10<br />
Jul-10<br />
Aug-10<br />
Sep-10<br />
Oct-10<br />
Nov-10<br />
Dec-10<br />
Jan-11<br />
Feb-11<br />
Mar-11<br />
PHNT NHS South West DoH Threshold<br />
Incomplete Pathways - Median Waits (weeks) as at Last day of Month<br />
Apr-10 May-10 Jun-10 Jul-10 Aug-10 Sep-10 Oct-10 Nov-10 Dec-10 Jan-11 Feb-11 Mar-11<br />
PHNT 5.5 5.5 5.3 5.4 5.8 5.8 5.7 5.4 6.0 6.3 4.7<br />
NHS South West 5.5 5.5 5.5 6.0 5.8 5.8 5.7 5.7 6.7 6.5<br />
DoH Threshold 7.2 7.2 7.2 7.2 7.2 7.2 7.2 7.2 7.2 7.2 7.2 7.2<br />
Weeks<br />
8<br />
7<br />
6<br />
5<br />
4<br />
3<br />
2<br />
1<br />
0<br />
Incomplete Pathways - Median waits<br />
Apr-10<br />
May-10<br />
Jun-10<br />
Jul-10<br />
Aug-10<br />
Sep-10<br />
Oct-10<br />
Nov-10<br />
Dec-10<br />
Jan-11<br />
Feb-11<br />
Mar-11<br />
PHNT NHS South West DoH Threshold<br />
Page 22
11<br />
Referral To Treatment (RTT) Times - 18 weeks monitoring<br />
RTT for Audiology Direct Access<br />
Current Month:<br />
February 2011<br />
Target = To Achieve Max 18 wks wait for 95% of Direct Access<br />
Audiology Referrals<br />
Apr-10 May-10 Jun-10 Jul-10 Aug-10 Sep-10 Oct-10 Nov-10 Dec-10 Jan-11 Feb-11 Mar-11<br />
Treated within 18 weeks 346 419 443 473 405 423 459 509 372 419 411<br />
Treated after 18 weeks 16 15 21 24 25 22 12 13 11 16 15<br />
% Treated within 18<br />
weeks<br />
95.6% 96.5% 95.5% 95.2% 94.2% 95.1% 97.5% 97.5% 97.1% 96.3% 96.5%<br />
Target 95.0% 95.0% 95.0% 95.0% 95.0% 95.0% 95.0% 95.0% 95.0% 95.0% 95.0% 95.0%<br />
100%<br />
% Patients Treated within 18 weeks<br />
98%<br />
96%<br />
94%<br />
92%<br />
90%<br />
Apr-09<br />
May-09<br />
Jun-09<br />
Jul-09<br />
Aug-09<br />
Sep-09<br />
Oct-09<br />
Nov-09<br />
Dec-09<br />
Jan-10<br />
Feb-10<br />
Mar-10<br />
Apr-10<br />
May-10<br />
Jun-10<br />
Jul-10<br />
Aug-10<br />
Sep-10<br />
Oct-10<br />
Nov-10<br />
Dec-10<br />
Jan-11<br />
Feb-11<br />
Mar-11<br />
% Within 18 wks Target<br />
Data Completeness Indicator<br />
Apr-10 May-10 Jun-10 Jul-10 Aug-10 Sep-10 Oct-10 Nov-10 Dec-10 Jan-11 Feb-11 Mar-11<br />
Actual 95.3% 118% 109% 116% 105% 105% 115% 120% 98% 116% 114%<br />
Tolerance Lower Limit 80% 80% 80% 80% 80% 80% 80% 80% 80% 80% 80% 80%<br />
Tolerance Upper Limit 120% 120% 120% 120% 120% 120% 120% 120% 120% 120% 120% 120%<br />
125.0%<br />
115.0%<br />
105.0%<br />
95.0%<br />
85.0%<br />
75.0%<br />
Apr-09<br />
May-09<br />
Jun-09<br />
Jul-09<br />
Aug-09<br />
Sep-09<br />
Oct-09<br />
Nov-09<br />
Dec-09<br />
Jan-10<br />
Feb-10<br />
Mar-10<br />
Apr-10<br />
May-10<br />
Jun-10<br />
Jul-10<br />
Aug-10<br />
Sep-10<br />
Oct-10<br />
Nov-10<br />
Dec-10<br />
Jan-11<br />
Feb-11<br />
Mar-11<br />
Actual Tolerance Lower Limit Tolerance Upper Limit<br />
Page 23
11<br />
Referral To Treatment (RTT) Times - IP/DC WL Patients<br />
No. & % Admitted Patients Waiting Over 14 Weeks With No TCI<br />
Current Month:<br />
February 2011<br />
Apr-10 May-10 Jun-10 Jul-10 Aug-10 Sep-10 Oct-10 Nov-10 Dec-10 Jan-11 Feb-11 Mar-11<br />
Total > 14 Weeks 280 291 407 365 576 756 792 866 1035 744 609<br />
Percentage > 14 Weeks 8.1% 8.0% 10.0% 8.9% 13.4% 16.3% 17.3% 18.2% 21.0% 18.1% 15.4%<br />
1200<br />
25.0%<br />
1000<br />
20.0%<br />
800<br />
600<br />
400<br />
15.0%<br />
10.0%<br />
200<br />
5.0%<br />
0<br />
0.0%<br />
Apr-2010<br />
May-2010<br />
Jun-2010<br />
Jul-2010<br />
Aug-2010<br />
Sep-2010<br />
Oct-2010<br />
Nov-2010<br />
Dec-2010<br />
Jan-2011<br />
Feb-2011<br />
Mar-2011<br />
Total > 14 Weeks<br />
% > 14 Weeks<br />
SPECIALTY<br />
Current Month<br />
Total > 14<br />
Weeks<br />
with no<br />
TCI<br />
% > 14<br />
weeks<br />
with no<br />
TCI<br />
Anaesthestics & Theatres<br />
ANChronic Pain<br />
3 33.3%<br />
Cardiothoracics<br />
CSCardiac Surgery<br />
10 7.5%<br />
CDCardiology<br />
13 18.6%<br />
TS Thoracic Surgery<br />
0<br />
VS Vascular Surgery<br />
0<br />
Children's Services<br />
PDPaediatrics<br />
0<br />
Gastroenterology, Surgery & Renal<br />
GAGastroenterology<br />
1 100.0%<br />
HPHepatology<br />
0<br />
ed Endoscopy<br />
0<br />
COColorectal Surgery<br />
10 6.4%<br />
UGUpper GI Surgery<br />
80 22.6%<br />
EDEndoscopy<br />
0<br />
GSGeneral Surgery<br />
96 37.8%<br />
URUrology<br />
35 19.7%<br />
NF Nephrology<br />
1 33.3%<br />
Haematology & Oncology<br />
RT Clinical Oncology<br />
0<br />
MOMedical Oncology<br />
0<br />
HMClin Haematology<br />
0<br />
CI Clin Immunology<br />
1 50.0%<br />
Head & Neck Surgery<br />
ET ENT<br />
13 4.7%<br />
AUAudiological Medicine<br />
0<br />
PL Plastic Surgery<br />
109 22.9%<br />
OSOral Surgery<br />
5 4.6%<br />
ODOrthodontics<br />
0<br />
RDRest Dent<br />
0<br />
DMDermatology<br />
22 18.5%<br />
Imaging<br />
NRNeuroradiology<br />
0<br />
RARadiology<br />
1 33.3%<br />
Medical Specialties<br />
DI Diabetic Medicine<br />
0<br />
ENEndocrinology<br />
0<br />
GMGeneral Medicine<br />
0<br />
HEHCE<br />
0<br />
TMThoracic Medicine<br />
0<br />
Neurosciences<br />
NSNeurosurgery<br />
47 29.7%<br />
NL Neurology<br />
0<br />
Ophthalmology<br />
OPOphthalmology<br />
34 4.8%<br />
Pathology & SDU<br />
NYNeuropathology<br />
0<br />
Orthopaedics & Rheumatology<br />
OROrthopaedics<br />
41 8.0%<br />
TR Trauma<br />
0<br />
RHRheumatology<br />
0<br />
Reproductive, Womens & Neonatal<br />
GYGynaecology<br />
87 31.5%<br />
BS Breast Surgery<br />
0<br />
PA PAC<br />
0<br />
NENeonatology<br />
0<br />
TT TOTAL<br />
609 15.4%<br />
Page 24
RAPID ACCESS CHEST PAIN SERVICE<br />
Current Month:<br />
February 2011<br />
Target : At least 98% of patients referred by their<br />
GP to a rapid access chest pain clinic must be<br />
seen within 2 weeks<br />
Percentage Seen Within 2 Weeks<br />
Current Month<br />
100.0%<br />
Year To Date<br />
100.0%<br />
Target<br />
100%<br />
% Within 2 Wks<br />
100%<br />
90%<br />
80%<br />
70%<br />
60%<br />
50%<br />
40%<br />
30%<br />
20%<br />
10%<br />
0%<br />
120<br />
100<br />
80<br />
60<br />
40<br />
20<br />
0<br />
Apr-09<br />
May-09<br />
Jun-09<br />
Jul-09<br />
Aug-09<br />
Sep-09<br />
Oct-09<br />
Nov-09<br />
Dec-09<br />
No. of referrals<br />
Jan-10<br />
Feb-10<br />
Mar-10<br />
Apr-10<br />
May-10<br />
Jun-10<br />
Jul-10<br />
Aug-10<br />
Sep-10<br />
Oct-10<br />
Nov-10<br />
Dec-10<br />
Jan-11<br />
Feb-11<br />
Mar-11<br />
No. of Referrals<br />
% Seen Within 2 Wks<br />
ANGIOGRAM WAITING TIMES<br />
Current Month:<br />
February 2011<br />
Internal target to achieve Max Wait of 4 weeks by<br />
end Sep 2010.<br />
2010/11 Apr May Jun Jul Aug Sep Oct Nov Dec Jan Feb Mar<br />
No waiting 0-1 wks 57 2 35 35 11 42 24 32 20 21 24<br />
No. waiting 2-5 wks 65 62 49 77 47 26 50 38 47 19 33<br />
No. waiting 6+ wks 2<br />
Target No. of 6+ weeks 0 0 0 0 0 0 0 0 0 0 0 0<br />
140<br />
Numbers On Angiogram Waiting List Over Time<br />
120<br />
100<br />
80<br />
60<br />
40<br />
20<br />
0<br />
Apr-09<br />
May-09<br />
Jun-09<br />
Jul-09<br />
Aug-09<br />
Sep-09<br />
Oct-09<br />
Nov-09<br />
Dec-09<br />
Jan-10<br />
Feb-10<br />
Mar-10<br />
Apr-10<br />
May-10<br />
Jun-10<br />
Jul-10<br />
Aug-10<br />
Sep-10<br />
Oct-10<br />
Nov-10<br />
Dec-10<br />
Jan-11<br />
Feb-11<br />
Mar-11<br />
No waiting 0-1 wks No. waiting 2-5 wks No. waiting 6+ wks<br />
REVASCULARISATION WAITING TIMES<br />
Current Month:<br />
February 2011<br />
Inpatient Stage of treatment wait : for information<br />
2010/11 Apr May Jun Jul Aug Sep Oct Nov Dec Jan Feb Mar<br />
Total 0-6 wks 111 94 111 87 68 111 120 116 117 107 124<br />
Total 7-10 wks 40 41 50 55 45 25 30 41 40 58 42<br />
Total 11+ wks 1 22 33 40 54 44 17 11 33 34 39<br />
250<br />
Numbers On Revascularisations on Waiting List Over Time<br />
200<br />
150<br />
100<br />
50<br />
0<br />
Apr-09<br />
May-09<br />
Jun-09<br />
Jul-09<br />
Aug-09<br />
Sep-09<br />
Oct-09<br />
Nov-09<br />
Dec-09<br />
Jan-10<br />
Feb-10<br />
Mar-10<br />
Apr-10<br />
May-10<br />
Jun-10<br />
Jul-10<br />
Aug-10<br />
Sep-10<br />
Oct-10<br />
Nov-10<br />
Dec-10<br />
Jan-11<br />
Feb-11<br />
Mar-11<br />
Total 0-6 wks Total 7-10 wks Total 11+ wks<br />
Page 25
MRI WAITING TIMES<br />
Current Month:<br />
February 2011 Internal target to achieve Max Wait of 4 weeks by end Sep 10.<br />
2010/11 Apr May Jun Jul Aug Sep Oct Nov Dec Jan Feb Mar<br />
No. waiting 0-1 wks 402 427 506 483 453 570 454 520 327 527 515<br />
No. waiting 2-5 wks 251 232 203 260 332 390 645 658 787 614 642<br />
No. waiting 6-12 wks 4 1 5 5 2<br />
No. waiting 13+ wks<br />
1400<br />
1200<br />
1000<br />
800<br />
600<br />
400<br />
200<br />
0<br />
Numbers On MRI Waiting List Over Time<br />
Apr-08<br />
Jun-08<br />
Aug-08<br />
Oct-08<br />
Dec-08<br />
Feb-09<br />
Apr-09<br />
Jun-09<br />
Aug-09<br />
Oct-09<br />
Dec-09<br />
Feb-10<br />
Apr-10<br />
Jun-10<br />
Aug-10<br />
Oct-10<br />
Dec-10<br />
Feb-11<br />
No. waiting 0-1 wks No. waiting 2-5 wks No. waiting 6-12 wks No. waiting 13+ wks<br />
CT WAITING TIMES<br />
Current Month:<br />
February 2011 Internal target to achieve Max Wait of 4 weeks by end Sep 10.<br />
2010/11 Apr May Jun Jul Aug Sep Oct Nov Dec Jan Feb Mar<br />
No. waiting 0-1 wks 315 405 493 415 367 418 440 434 310 480 450<br />
No. waiting 2-5 wks 237 323 423 357 251 279 292 313 485 263 260<br />
No. waiting 6-12 wks 5 5 5 46 32 49 50<br />
No. waiting 13+ wks<br />
1000<br />
Numbers On CT Waiting List Over Time<br />
800<br />
600<br />
400<br />
200<br />
0<br />
Apr-08<br />
Jun-08<br />
Aug-08<br />
Oct-08<br />
Dec-08<br />
Feb-09<br />
Apr-09<br />
Jun-09<br />
Aug-09<br />
Oct-09<br />
Dec-09<br />
Feb-10<br />
Apr-10<br />
Jun-10<br />
Aug-10<br />
Oct-10<br />
Dec-10<br />
Feb-11<br />
No. waiting 0-1 wks No. waiting 2-5 wks No. waiting 6-12 wks No. waiting 13+ wks<br />
OTHER IMAGING WAITING TIMES<br />
Includes Non Obstetric Ultrasound, Barium Enemas, Nuclear Medicine, X-Ray, IVU, Flurography, Symphomatic Mammography<br />
Current Month:<br />
February 2011 Internal target to achieve Max Wait of 4 weeks by end Sep 10.<br />
2010/11 Apr May Jun Jul Aug Sep Oct Nov Dec Jan Feb Mar<br />
No. waiting 0-1 wks 1609 1542 1508 1405 1304 1520 1311 1556 1030 1544 1605<br />
No. waiting 2-5 wks 839 862 784 724 786 722 960 707 937 472 603<br />
No. waiting 6-12 wks 1 4 1<br />
No. waiting 13+ wks<br />
3500<br />
3000<br />
Numbers On Other Imaging Waiting List Over Time<br />
2500<br />
2000<br />
1500<br />
1000<br />
500<br />
0<br />
Apr-08<br />
May-08<br />
Jun-08<br />
Jul-08<br />
Aug-08<br />
Sep-08<br />
Oct-08<br />
Nov-08<br />
Dec-08<br />
Jan-09<br />
Feb-09<br />
Mar-09<br />
Apr-09<br />
May-09<br />
Jun-09<br />
Jul-09<br />
Aug-09<br />
Sep-09<br />
Oct-09<br />
Nov-09<br />
Dec-09<br />
Jan-10<br />
Feb-10<br />
Mar-10<br />
Apr-10<br />
May-10<br />
Jun-10<br />
Jul-10<br />
Aug-10<br />
Sep-10<br />
Oct-10<br />
Nov-10<br />
Dec-10<br />
Jan-11<br />
Feb-11<br />
Mar-11<br />
No. waiting 0-1 wks No. waiting 2-5 wks No. waiting 6-12 wks No. waiting 13+ wks<br />
Page 26
DIAGNOSTIC NEUROPHYSIOLOGY WAITING TIMES<br />
Current Month:<br />
February 2011<br />
Internal target to achieve Max Wait of 4 weeks by end Sep 10.<br />
2010/11 Apr May Jun Jul Aug Sep Oct Nov Dec Jan Feb Mar<br />
No. waiting 0-1 wks 205 211 200 203 135 198 218 240 134 163 128<br />
No. waiting 2-5 wks 206 251 224 202 200 160 176 192 302 209 226<br />
No. waiting 6-12 wks 2 4 1 3 2 14 8 2<br />
No. waiting 13+ wks 1<br />
500<br />
400<br />
300<br />
200<br />
100<br />
0<br />
Numbers On Neurophysiology Waiting List Over Time<br />
Apr-08<br />
Jun-08<br />
Aug-08<br />
Oct-08<br />
Dec-08<br />
Feb-09<br />
Apr-09<br />
Jun-09<br />
Aug-09<br />
Oct-09<br />
Dec-09<br />
Feb-10<br />
Apr-10<br />
Jun-10<br />
Aug-10<br />
Oct-10<br />
Dec-10<br />
Feb-11<br />
No. waiting 0-1 wks No. waiting 2-5 wks No. waiting 6-12 wks No. waiting 13+ wks<br />
DIAGNOSTIC CARDIOLOGY WAITING TIMES (excludes Angiograms)<br />
Current Month:<br />
February 2011<br />
Internal target to achieve Max Wait of 4 weeks by end Sep 10.<br />
2010/11 Apr May Jun Jul Aug Sep Oct Nov Dec Jan Feb Mar<br />
No. waiting 0-1 wks 269 262 257 252 229 242 176 207 180 312 228<br />
No. waiting 2-5 wks 107 178 189 201 224 204 194 181 239 160 214<br />
No. waiting 6-12 wks<br />
No. waiting 13+ wks<br />
600<br />
Numbers On Diagnostic Cardiology Waiting List Over Time<br />
500<br />
400<br />
300<br />
200<br />
100<br />
0<br />
Apr-08<br />
Jun-08<br />
Aug-08<br />
Oct-08<br />
Dec-08<br />
Feb-09<br />
Apr-09<br />
Jun-09<br />
Aug-09<br />
Oct-09<br />
Dec-09<br />
Feb-10<br />
Apr-10<br />
Jun-10<br />
Aug-10<br />
Oct-10<br />
Dec-10<br />
Feb-11<br />
No. waiting 0-1 wks No. waiting 2-5 wks No. waiting 6-12 wks No. waiting 13+ wks<br />
AUDIOLOGY WAITING TIMES<br />
Current Month:<br />
February 2011<br />
Internal target to achieve Max Wait of 4 weeks by end<br />
Sep 10.<br />
2010/11 Apr May Jun Jul Aug Sep Oct Nov Dec Jan Feb Mar<br />
No. waiting 0-1 wks 378 319 339 365 293 284 285 266 172 263 288<br />
No. waiting 2-5 wks 213 193 171 179 210 179 215 182 251 181 202<br />
No. waiting 6-12 wks 1 5 2 7 3<br />
No. waiting 13+ wks 1 1<br />
800<br />
700<br />
600<br />
500<br />
400<br />
300<br />
200<br />
100<br />
0<br />
Numbers On Audiology Waiting List Over Time<br />
Apr-08<br />
Jun-08<br />
Aug-08<br />
Oct-08<br />
Dec-08<br />
Feb-09<br />
Apr-09<br />
Jun-09<br />
Aug-09<br />
Oct-09<br />
Dec-09<br />
Feb-10<br />
Apr-10<br />
Jun-10<br />
Aug-10<br />
Oct-10<br />
Dec-10<br />
Feb-11<br />
No. waiting 0-1 wks No. waiting 2-5 wks No. waiting 6-12 wks No. waiting 13+ wks<br />
Page 27
URODYNAMICS WAITING TIMES<br />
Current Month:<br />
February 2011 Internal target to achieve Max Wait of 4 weeks by end Sep 10.<br />
2010/11 Apr May Jun Jul Aug Sep Oct Nov Dec Jan Feb Mar<br />
No. waiting 0-1 wks 26 19 19 21 14 24 21 26 15 19 22<br />
No. waiting 2-5 wks 31 7 4 6 5 8 5 9 35 17 3<br />
No. waiting 6-12 wks 3 2 3<br />
No. waiting 13+ wks<br />
90<br />
80<br />
70<br />
60<br />
50<br />
40<br />
30<br />
20<br />
10<br />
0<br />
Numbers On Urodynamics Waiting List Over Time<br />
Apr-08<br />
May-08<br />
Jun-08<br />
Jul-08<br />
Aug-08<br />
Sep-08<br />
Oct-08<br />
Nov-08<br />
Dec-08<br />
Jan-09<br />
Feb-09<br />
Mar-09<br />
Apr-09<br />
May-09<br />
Jun-09<br />
Jul-09<br />
Aug-09<br />
Sep-09<br />
Oct-09<br />
Nov-09<br />
Dec-09<br />
Jan-10<br />
Feb-10<br />
Mar-10<br />
Apr-10<br />
May-10<br />
Jun-10<br />
Jul-10<br />
Aug-10<br />
Sep-10<br />
Oct-10<br />
Nov-10<br />
Dec-10<br />
Jan-11<br />
Feb-11<br />
Mar-11<br />
No. waiting 0-1 wks No. waiting 2-5 wks No. waiting 6-12 wks No. waiting 13+ wks<br />
ALL OTHER DIAGNOSTICS WAITING TIMES<br />
Includes Endoscopies, Other Scopes, Respiratory Physiology, Ophthalmics, GI Physiology & Miscellaneous Others<br />
Current Month:<br />
February 2011 Internal target to achieve Max Wait of 4 weeks by end Sep 10.<br />
2010/11 Apr May Jun Jul Aug Sep Oct Nov Dec Jan Feb Mar<br />
No. waiting 0-1 wks 767 756 873 730 584 722 674 662 455 637 766<br />
No. waiting 2-5 wks 696 793 669 590 706 595 564 517 672 471 577<br />
No. waiting 6-12 wks 3 8 54 114 81 43 16 17 32 181 76<br />
No. waiting 13+ wks 2 1 1 32 29 17 3 4 4 2 2<br />
1800<br />
1600<br />
1400<br />
1200<br />
1000<br />
800<br />
600<br />
400<br />
200<br />
0<br />
Numbers On Other Diagnostic Waiting List Over Time<br />
Apr-08<br />
May-08<br />
Jun-08<br />
Jul-08<br />
Aug-08<br />
Sep-08<br />
Oct-08<br />
Nov-08<br />
Dec-08<br />
Jan-09<br />
Feb-09<br />
Mar-09<br />
Apr-09<br />
May-09<br />
Jun-09<br />
Jul-09<br />
Aug-09<br />
Sep-09<br />
Oct-09<br />
Nov-09<br />
Dec-09<br />
Jan-10<br />
Feb-10<br />
Mar-10<br />
Apr-10<br />
May-10<br />
Jun-10<br />
Jul-10<br />
Aug-10<br />
Sep-10<br />
Oct-10<br />
Nov-10<br />
Dec-10<br />
Jan-11<br />
Feb-11<br />
Mar-11<br />
No. waiting 0-1 wks No. waiting 2-5 wks No. waiting 6-12 wks No. waiting 13+ wks<br />
ENDOSCOPY SURVEILLANCE WAITING TIMES<br />
Planned Follow-Up Patients Who Have Passed Their Appointment By Date<br />
Current Month:<br />
February 2011<br />
2010/11 Apr May Jun Jul Aug Sep Oct Nov Dec Jan Feb Mar<br />
No. waiting 0-1 wks 74 91 57 74 42 71 63 80 56 92 76<br />
No. waiting 2-5 wks 61 81 65 65 81 51 79 78 84 124 117<br />
No. waiting 6-12 wks 44 49 73 29 41 58 36 20 38 53 141<br />
No. waiting 13+ wks 111 97 77 68 62 75 55 15 14 38 5<br />
Maximum Wait (Weeks) 43 47 52 56 52 47 30 30 17 21 21<br />
400<br />
350<br />
300<br />
250<br />
200<br />
150<br />
100<br />
50<br />
0<br />
Numbers On Other Endoscopy Surveillance List Over Time<br />
Apr-10<br />
May-10<br />
Jun-10<br />
Jul-10<br />
Aug-10<br />
Sep-10<br />
Oct-10<br />
Nov-10<br />
Dec-10<br />
Jan-11<br />
Feb-11<br />
Mar-11<br />
No. waiting 0-1 wks No. waiting 2-5 wks No. waiting 6-12 wks No. waiting 13+ wks<br />
Page 28
#<br />
Inpatient & Day Case Waiting List : Planned Patients<br />
Current Month:<br />
February 2011<br />
No. on List<br />
1600<br />
1500<br />
1400<br />
1300<br />
1200<br />
1100<br />
1000<br />
Total Number on Planned Waiting List<br />
Apr-08<br />
May-08<br />
Jun-08<br />
Jul-08<br />
Aug-08<br />
Sep-08<br />
Oct-08<br />
Nov-08<br />
Dec-08<br />
Jan-09<br />
Feb-09<br />
Mar-09<br />
Apr-09<br />
May-09<br />
Jun-09<br />
Jul-09<br />
Aug-09<br />
Sep-09<br />
Oct-09<br />
Nov-09<br />
Dec-09<br />
Jan-10<br />
Feb-10<br />
Mar-10<br />
Apr-10<br />
May-10<br />
Jun-10<br />
Jul-10<br />
Aug-10<br />
Sep-10<br />
Oct-10<br />
Nov-10<br />
Dec-10<br />
Jan-11<br />
Feb-11<br />
Mar-11<br />
25%<br />
20%<br />
% on Planned Waiting List who have Passed Their Treat By Date<br />
No. on List<br />
15%<br />
10%<br />
5%<br />
0%<br />
Apr-08<br />
May-08<br />
Jun-08<br />
Jul-08<br />
Aug-08<br />
Sep-08<br />
Oct-08<br />
Nov-08<br />
Dec-08<br />
Jan-09<br />
Feb-09<br />
Mar-09<br />
Apr-09<br />
May-09<br />
Jun-09<br />
Jul-09<br />
Aug-09<br />
Sep-09<br />
Oct-09<br />
Nov-09<br />
Dec-09<br />
Jan-10<br />
Feb-10<br />
Mar-10<br />
Apr-10<br />
May-10<br />
Jun-10<br />
Jul-10<br />
Aug-10<br />
Sep-10<br />
Oct-10<br />
Nov-10<br />
Dec-10<br />
Jan-11<br />
Feb-11<br />
Mar-11<br />
No. Waiting Longer<br />
Than "Treat By Date"<br />
No. with no "Treat By<br />
Date" recorded on<br />
iPM<br />
SPECIALTY<br />
Total Number on List<br />
Anaesthestics & Theatres<br />
Chronic Pain 17 5 0<br />
Cardiothoracics<br />
Cardiac Surgery 0 0 0<br />
Cardiology 34 10 0<br />
Thoracic Surgery 8 0 0<br />
Vascular Surgery 8 0 0<br />
Children's Services<br />
Paediatrics 1 1 0<br />
Gastroenterology, Surgery & Renal Services<br />
Gastroenterology 21 14 0<br />
Hepatology 9 3 0<br />
Colorectal Surgery 17 1 0<br />
Upper GI Surgery 3 0 0<br />
Endoscopy 0 0 0<br />
General Surgery 2 2 0<br />
Urology 628 34 0<br />
Nephrology 69 8 2<br />
Haematology & Oncology<br />
Clinical Oncology 45 14 0<br />
Medical Oncology 2 1 0<br />
Clin Haematology 45 22 0<br />
Clin Immunology 2 2 0<br />
Head & Neck Surgery<br />
ENT 100 24 1<br />
Plastic Surgery 53 11 0<br />
Oral Surgery 2 0 0<br />
Orthodontics 0 0 0<br />
Rest Dent 0 0 0<br />
Dermatology 15 4 0<br />
Imaging<br />
Neuroradiology 0 0 0<br />
Radiology 0 0 0<br />
Medical Specialties<br />
Diabetic Medicine 0 0 0<br />
Endocrinology 14 4 1<br />
General Medicine 3 0 0<br />
HCE 0 0 0<br />
Thoracic Medicine 8 6 0<br />
Neurosciences<br />
Neurosurgery 11 2 0<br />
Neurology 26 2 0<br />
Neurophysiology 0 0 0<br />
Ophthalmology<br />
Ophthalmology 23 8 8<br />
Pathology & SDU<br />
Neuropathology 0 0 0<br />
Orthopaedics & Rheumatology<br />
Orthopaedics 28 3 0<br />
Rheumatology 37 11 0<br />
Reproductive, Womens & Neonatal Services<br />
Gynaecology 1 1 0<br />
Breast Surgery 0 0 0<br />
PAC 0 0 0<br />
Neonatology 0 0 0<br />
TOTAL 1232 193 12<br />
Page 29
#<br />
Inpatient & Day Case Waiting List : Suspended Patients<br />
Current Month: February 2011<br />
No. on List<br />
800<br />
700<br />
600<br />
500<br />
400<br />
300<br />
200<br />
100<br />
0<br />
Total Number of Patients Currently Suspended<br />
Apr-08<br />
May-08<br />
Jun-08<br />
Jul-08<br />
Aug-08<br />
Sep-08<br />
Oct-08<br />
Nov-08<br />
Dec-08<br />
Jan-09<br />
Feb-09<br />
Mar-09<br />
Apr-09<br />
May-09<br />
Jun-09<br />
Jul-09<br />
Aug-09<br />
Sep-09<br />
Oct-09<br />
Nov-09<br />
Dec-09<br />
Jan-10<br />
Feb-10<br />
Mar-10<br />
Apr-10<br />
May-10<br />
Jun-10<br />
Jul-10<br />
Aug-10<br />
Sep-10<br />
Oct-10<br />
Nov-10<br />
Dec-10<br />
Jan-11<br />
Feb-11<br />
Mar-11<br />
Total Number on<br />
Active Waiting List<br />
Total Number<br />
Suspended<br />
% Suspended of Total<br />
WL<br />
SPECIALTY<br />
Anaesthestics & Theatres<br />
Chronic Pain 17 0 0.0%<br />
Cardiothoracics<br />
Cardiac Surgery 235 1 0.4%<br />
Cardiology 249 5 2.0%<br />
Thoracic Surgery 21 2 8.7%<br />
Vascular Surgery 118 3 2.5%<br />
Children's Services<br />
Paediatrics 17 0 0.0%<br />
Gastroenterology, Surgery & Renal Services<br />
Gastroenterology 21 0 0.0%<br />
Hepatology 20 1 4.8%<br />
Colorectal Surgery 248 12 4.6%<br />
Upper GI Surgery 487 18 3.6%<br />
Endoscopy 0 0 0.0%<br />
General Surgery 363 26 6.7%<br />
Urology 304 19 5.9%<br />
Nephrology 31 0 0.0%<br />
Haematology & Oncology<br />
Clinical Oncology 255 0 0.0%<br />
Medical Oncology 19 0 0.0%<br />
Palliative Medicine 0 0 0.0%<br />
Clin Haematology 5 0 0.0%<br />
Clin Immunology 2 0 0.0%<br />
Head & Neck Surgery<br />
ENT 420 29 6.5%<br />
Plastic Surgery 0 0 0.0%<br />
Plastic Surgery - Hands 691 43 5.9%<br />
Oral Surgery 222 24 9.8%<br />
Orthodontics 18 2 10.0%<br />
Rest Dent 20 0 0.0%<br />
Dermatology 205 12 5.5%<br />
Imaging<br />
Neuroradiology 1 0 0.0%<br />
Radiology 4 0 0.0%<br />
Medical Specialties<br />
Diabetic Medicine 0 0 0.0%<br />
Endocrinology 19 0 0.0%<br />
General Medicine 0 0 0.0%<br />
HCE 0 0 0.0%<br />
Thoracic Medicine 26 0 0.0%<br />
Neurosciences<br />
Neurosurgery 237 3 1.3%<br />
Neurology 73 1 1.4%<br />
Neurophysiology 0 0 0.0%<br />
Ophthalmology<br />
Ophthalmology 1056 35 3.2%<br />
Pathology & SDU<br />
Neuropathology 4 0 0.0%<br />
Orthopaedics & Rheumatology<br />
Orthopaedics 889 79 8.2%<br />
Trauma 0 0 0.0%<br />
Rheumatology 11 0 0.0%<br />
Reproductive, Womens & Neonatal Services<br />
Gynaecology 415 65 13.5%<br />
Gynaecological Oncology 14 0 0.0%<br />
Breast Surgery 39 4 9.3%<br />
PAC 11 0 0.0%<br />
Neonatology 0 0 0.0%<br />
TOTAL 6787 384 5.4%<br />
Page 30
#<br />
CANCELLED OPERATIONS - Number cancelled on the day of admission or later for non clinical reasons<br />
Current Month:<br />
February 2011<br />
Cancelled on Day<br />
of Operation<br />
and/or Admission<br />
As % of total<br />
Elective FFCEs<br />
Feb-11 YTD Feb-11 YTD<br />
<strong>Trust</strong> Total 69 848 1.5% 1.6%<br />
No of Cancelled<br />
Operations<br />
200<br />
150<br />
100<br />
50<br />
0<br />
No. of Operations Cancelled On Day of Operation Or Admission<br />
4.0%<br />
3.5%<br />
3.0%<br />
2.5%<br />
2.0%<br />
1.5%<br />
1.0%<br />
0.5%<br />
0.0%<br />
Apr-08<br />
Jun-08<br />
Aug-08<br />
Oct-08<br />
Dec-08<br />
Feb-09<br />
Apr-09<br />
Jun-09<br />
Aug-09<br />
Oct-09<br />
Dec-09<br />
Feb-10<br />
Apr-10<br />
Jun-10<br />
Aug-10<br />
Oct-10<br />
Dec-10<br />
Cancelled / Total of<br />
Elective FFCEs (%)<br />
Feb-11<br />
No of Cancelled Operations % Cancelled Planned Trajectory for % cancelled<br />
Reasons for Cancellations By Month Apr-10 May-10 Jun-10 Jul-10 Aug-10 Sep-10 Oct-10 Nov-10 Dec-10 Jan-11 Feb-11 Mar-11 YTD<br />
Anaesthetist Sick/Unavailable 1 1 1 2 1 6<br />
Anaesthetist On Leave 3 1 4<br />
Surgeon Sick/Unavailable 4 5 7 2 7 3 22 4 24 78<br />
Surgeon On Leave<br />
No General Bed Available 17 24 20 15 11 1 3 10 12 20 5 138<br />
No Critical Care Bed Available Post<br />
Operatively 6 3 1 2 1 4 2 6 7 1 33<br />
Equipment Missing/Failure 12 5 3 2 3 4 6 14 5 2 56<br />
No Space On Theatre List/Emerg Took<br />
Priority 13 12 11 17 9 23 18 20 10 10 12 155<br />
Theatre List Overran 24 21 23 19 31 28 11 38 21 31 13 260<br />
Lack Of Theatre Staff 1 4 7 2 1 8 3 7 8 7 5 53<br />
Other 12 9 6 5 2 3 6 7 5 4 6 65<br />
Total 86 82 79 68 58 69 58 93 98 88 69 848<br />
Reasons for Cancellations By<br />
Directorate Year To Date<br />
Anaesthestics &<br />
Theatres<br />
Cardiothoracics<br />
Children's Services<br />
Gastro, Surgery &<br />
Renal<br />
Haematology &<br />
Oncology<br />
Head & Neck<br />
Surgery<br />
Imaging<br />
Medical Specialties<br />
Neurosciences<br />
Ophthalmology<br />
Orthopaedics &<br />
Rheumatology<br />
Reproductive,<br />
Womens & Neonatal<br />
Services<br />
TOTAL<br />
Anaesthetist Sick/Unavailable 2 1 2 1 6<br />
Anaesthetist On Leave 3 1 4<br />
Surgeon Sick/Unavailable 6 10 8 20 6 15 10 3 78<br />
Surgeon On Leave<br />
No General Bed Available 18 1 18 18 2 5 46 18 12 138<br />
No Critical Care Bed Available Post<br />
Operatively 26 1 1 2 2 1 33<br />
Equipment Missing/Failure 16 13 9 1 1 2 2 9 3 56<br />
No Space On Theatre List/Emerg Took<br />
Priority 37 15 30 2 35 1 25 10 155<br />
Theatre List Overran 26 55 65 21 5 57 31 260<br />
Lack Of Theatre Staff 1 31 6 2 5 1 7 53<br />
Other 1 7 18 1 16 2 10 3 3 4 65<br />
Total 8 174 1 137 2 161 5 10 127 27 132 64 848<br />
#<br />
CANCELLED OPERATIONS - Number who breach the 28 day standard on offering another binding date<br />
Current Month:<br />
February 2011<br />
Breaches of the 28 Day Standard<br />
2009/10 Current Month<br />
2010/11 Year To<br />
Date<br />
No. % No. % No. %<br />
155 14.1% 0 0.0%<br />
27 3.2%<br />
No. of breaches<br />
30<br />
25<br />
20<br />
15<br />
10<br />
5<br />
Breaches of the 28 Day Standard<br />
35.0%<br />
30.0%<br />
25.0%<br />
20.0%<br />
15.0%<br />
10.0%<br />
5.0%<br />
% Breaches<br />
0<br />
0.0%<br />
Apr-08<br />
Jun-08<br />
Aug-08<br />
Oct-08<br />
Dec-08<br />
Feb-09<br />
Apr-09<br />
Jun-09<br />
Aug-09<br />
Oct-09<br />
Dec-09<br />
Feb-10<br />
Apr-10<br />
Jun-10<br />
Aug-10<br />
Oct-10<br />
Dec-10<br />
Feb-11<br />
No. of Breaches<br />
% Breaches<br />
Page 31
CANCELLED OPERATIONS BY SPECIALTY<br />
Current Month:<br />
Feb-11<br />
No. of<br />
Cancelled<br />
Operations<br />
No. of<br />
FFCEs<br />
Year To Date Figures<br />
% of<br />
Patients<br />
Cancelled<br />
No.<br />
breaching 28<br />
day rebooking<br />
standard<br />
% of Canc<br />
Ops<br />
Breaching 28<br />
days<br />
No. of<br />
Cancelled<br />
Ops With<br />
Previous<br />
Cancelled<br />
Op<br />
SPECIALTY<br />
Anaesthestics & Theatres<br />
Chronic Pain 8 444 1.8% 0 0.0% 0<br />
Intensive Care 0 0 0.0% 0 0.0% 0<br />
Cardiothoracics<br />
Cardiac Surgery 94 787 11.9% 1 1.1% 3<br />
Cardiology 27 2225 1.2% 1 3.7% 1<br />
Thoracic Surgery 9 555 1.6% 0 0.0% 0<br />
Vascular Surgery 44 805 5.5% 1 2.3% 1<br />
Children's Services<br />
Paediatrics 1 533 0.2% 0 0.0% 0<br />
Emergency Services<br />
A&E 0 0 0.0% 0 0.0% 0<br />
Acute Medicine 0 17 0.0% 0 0.0% 0<br />
Gastroenterology, Surgery & Renal Services<br />
Gastroenterology 4 640 0.6% 1 25.0% 0<br />
Hepatology 7 527 1.3% 1 14.3% 0<br />
Colorectal Surgery 23 1437 1.6% 0 0.0% 0<br />
Upper GI Surgery 35 1351 2.6% 3 8.6% 2<br />
Endoscopy 0 8 0.0% 0 0.0% 0<br />
General Surgery 22 1295 1.7% 1 4.5% 0<br />
Urology 42 4422 0.9% 3 7.1% 0<br />
Nephrology 4 813 0.5% 0 0.0% 0<br />
Haematology & Oncology<br />
Clinical Oncology 1 5787 0.0% 0 0.0% 0<br />
Medical Oncology 0 355 0.0% 0 0.0% 0<br />
Palliative Medicine 0 5 0.0% 0 0.0% 0<br />
Clin Haematology 1 2339 0.0% 0 0.0% 0<br />
Clin Immunology 0 323 0.0% 0 0.0% 0<br />
Head & Neck Surgery<br />
ENT 54 2169 2.5% 2 3.7% 0<br />
Audiological Medicine 0 0 0.0% 0 0.0% 0<br />
Plastic Surgery 54 3804 1.4% 0 0.0% 1<br />
Maxillo-Facial Surgery 27 1374 2.0% 0 0.0% 0<br />
Orthodontics 1 91 1.1% 0 0.0% 0<br />
Rest Dent 0 67 0.0% 0 0.0% 0<br />
Dermatology 25 2106 1.2% 0 0.0% 0<br />
Imaging<br />
Neuroradiology 5 45 11.1% 0 0.0% 0<br />
Nuclear Medicine 0 0 0.0% 0 0.0% 0<br />
Radiology 0 12 0.0% 0 0.0% 0<br />
Medical Specialties<br />
Diabetic Medicine 0 292 0.0% 0 0.0% 0<br />
Endocrinology 3 57 5.3% 1 33.3% 1<br />
General Medicine 0 0 0.0% 0 0.0% 0<br />
HCE 0 46 0.0% 0 0.0% 0<br />
Thoracic Medicine 7 540 1.3% 0 0.0% 0<br />
Neurosciences<br />
Neurosurgery 108 1481 7.3% 8 7.4% 6<br />
Neurology 19 672 2.8% 2 10.5% 0<br />
Neurophysiology 0 6 0.0% 0 0.0% 0<br />
Ophthalmology<br />
Ophthalmology 27 5373 0.5% 1 3.7% 0<br />
Pathology & SDU<br />
Clin Chemistry 0 0 0.0% 0 0.0% 0<br />
Neuropathology 0 75 0.0% 0 0.0% 0<br />
Orthopaedics & Rheumatology<br />
Orthopaedics 129 5100 2.5% 1 0.8% 2<br />
Trauma 0 0 0.0% 0 0.0% 0<br />
Rheumatology 3 518 0.6% 0 0.0% 0<br />
Reproductive, Womens & Neonatal Services<br />
Gynaecology 51 1967 2.6% 0 0.0% 1<br />
Gynaecology Oncology 5 300 1.7% 0 0.0% 0<br />
Breast Surgery 8 677 1.2% 0 0.0% 0<br />
PAC 0 1043 0.0% 0 0.0% 0<br />
Obstetrics 0 0 0.0% 0 0.0% 0<br />
GUM 0 0 0.0% 0 0.0% 0<br />
Neonatology 0 27 0.0% 0 0.0% 0<br />
TOTAL 848 52510 1.6% 27 3.2% 18<br />
Page 32
9<br />
Choose And Book Slot unavailability<br />
Latest Data up to<br />
Week Ending 23/01/2011<br />
PHNT Versus Regional Acute Providers Average<br />
Last 13 Weeks<br />
actual<br />
31-Oct-10<br />
07-Nov-10<br />
14-Nov-10<br />
21-Nov-10<br />
28-Nov-10<br />
PHNT 2% 2% 6% 8% 10% 10% 8% 10% 7% 2% 2% 2% 3%<br />
Regional Average 8% 8% 7% 6% 7% 7% 7% 7% 5% 4% 4% 4% 4%<br />
Gap 6% 6% 1% (2%) (3%) (3%) (1%) (3%) (2%) 2% 2% 2% 1%<br />
05-Dec-10<br />
12-Dec-10<br />
19-Dec-10<br />
26-Dec-10<br />
02-Jan-11<br />
09-Jan-11<br />
16-Jan-11<br />
23-Jan-11<br />
20%<br />
PHNT v Regional Acute Providers Average (actual)<br />
18%<br />
16%<br />
14%<br />
12%<br />
10%<br />
8%<br />
6%<br />
4%<br />
2%<br />
0%<br />
28-Feb-10<br />
14-Mar-10<br />
28-Mar-10<br />
11-Apr-10<br />
25-Apr-10<br />
09-May-10<br />
23-May-10<br />
06-Jun-10<br />
20-Jun-10<br />
04-Jul-10<br />
18-Jul-10<br />
01-Aug-10<br />
15-Aug-10<br />
29-Aug-10<br />
12-Sep-10<br />
26-Sep-10<br />
10-Oct-10<br />
24-Oct-10<br />
07-Nov-10<br />
21-Nov-10<br />
05-Dec-10<br />
19-Dec-10<br />
02-Jan-11<br />
16-Jan-11<br />
PHNT Regional Average Target %age<br />
7<br />
Choose And Book Slot unavailability<br />
Latest Data up to<br />
Week Ending 23/01/2011<br />
PHNT Versus Regional Acute Providers Average<br />
Last 13 Weeks<br />
rolling 4 weekly<br />
average<br />
31-Oct-10<br />
07-Nov-10<br />
14-Nov-10<br />
21-Nov-10<br />
28-Nov-10<br />
PHNT 4% 4% 4% 5% 7% 9% 9% 9% 8% 7% 6% 3% 2%<br />
Regional Average 8% 7% 7% 7% 7% 7% 7% 7% 7% 6% 5% 4% 4%<br />
Gap 4% 3% 3% 2% 0% (2%) (2%) (2%) (1%) (1%) (1%) 1% 2%<br />
05-Dec-10<br />
12-Dec-10<br />
19-Dec-10<br />
26-Dec-10<br />
02-Jan-11<br />
09-Jan-11<br />
16-Jan-11<br />
23-Jan-11<br />
16% 100%<br />
PHNT v Regional No. Seen Acute within Providers 48 hrs Average of Contacting (rolling Service 4 weekly average)<br />
14%<br />
90%<br />
12%<br />
10%<br />
80%<br />
8%<br />
6% 70%<br />
4%<br />
60%<br />
2%<br />
0%<br />
50%<br />
07-Mar-10<br />
40%<br />
21-Mar-10<br />
04-Apr-10<br />
18-Apr-10<br />
02-May-10<br />
16-May-10<br />
30-May-10<br />
13-Jun-10<br />
27-Jun-10<br />
11-Jul-10<br />
25-Jul-10<br />
08-Aug-10<br />
22-Aug-10<br />
05-Sep-10<br />
19-Sep-10<br />
03-Oct-10<br />
17-Oct-10<br />
31-Oct-10<br />
14-Nov-10<br />
28-Nov-10<br />
12-Dec-10<br />
26-Dec-10<br />
09-Jan-11<br />
23-Jan-11<br />
15%<br />
14%<br />
PHNT Regional Average Target %age<br />
15%<br />
Page 33
February 2011<br />
Apr-09 May-09 Jun-09 Jul-09 Aug-09 Sep-09 Oct-09 Nov-09 Dec-09 Jan-10 Feb-10 Mar-10 YTD<br />
Number 1st Seen 849 813 934 1040 814 937 940 841 931 660 846 1052 10657<br />
Number of Breaches 54 36 66 61 54 59 46 31 53 44 22 47 573<br />
Number of Breaches excluding patient<br />
choice & medical reasons<br />
CANCER TARGETS : 2 Week Wait from Urgent GP referral for suspected cancer<br />
10 0 2 1 2 3 0 0 4 0 0 1 23<br />
Performance 93.6% 95.6% 92.9% 94.1% 93.4% 93.7% 95.1% 96.3% 94.3% 93.3% 97.4% 95.5% 94.6%<br />
DOH Target 93% 93% 93% 93% 93% 93% 93% 93% 93% 93% 93% 93% 93%<br />
Apr-10 May-10 Jun-10 Jul-10 Aug-10 Sep-10 Oct-10 Nov-10 Dec-10 Jan-11 Feb-11 Mar-11 YTD<br />
Number 1st Seen 900 860 1032 1054 920 1031 909 970 798 752 969 10195<br />
Number of Breaches 47 45 47 42 47 51 39 45 28 47 43 481<br />
Number of Breaches excluding patient<br />
choice & medical reasons<br />
10 3 2 0 2 3 2 1 1 0 0 24<br />
Performance 94.8% 94.8% 95.4% 96.0% 94.9% 95.1% 95.7% 95.4% 96.5% 93.8% 95.6% 95.3%<br />
DOH Target 93% 93% 93% 93% 93% 93% 93% 93% 93% 93% 93% 93% 93%<br />
1100<br />
100%<br />
1000<br />
95%<br />
900<br />
90%<br />
800<br />
85%<br />
700<br />
600<br />
500<br />
400<br />
80%<br />
75%<br />
70%<br />
300<br />
65%<br />
200<br />
60%<br />
100<br />
55%<br />
0<br />
Apr-<br />
07<br />
Jun-<br />
07<br />
Aug-<br />
07<br />
Oct-<br />
07<br />
Dec-<br />
07<br />
Feb-<br />
08<br />
Apr-<br />
08<br />
Jun-<br />
08<br />
Aug-<br />
08<br />
Oct-<br />
08<br />
Dec-<br />
08<br />
Feb-<br />
09<br />
Apr-<br />
09<br />
Jun-<br />
09<br />
Aug-<br />
09<br />
Oct-<br />
09<br />
Dec-<br />
09<br />
Feb-<br />
10<br />
Apr-<br />
10<br />
Jun-<br />
10<br />
Aug-<br />
10<br />
Oct-<br />
10<br />
Dec-<br />
10<br />
Feb-<br />
11<br />
50%<br />
Number 1st Seen <strong>Trust</strong> Performance DOH Target<br />
Breaches<br />
Patient Choice 43<br />
Medical Reasons<br />
Outpatient Capacity<br />
Administration delay<br />
TOTAL 43<br />
Patient Choice<br />
Medical Reasons<br />
Outpatient Capacity<br />
Administration delay<br />
Page 34
CANCER TARGETS : 31 Day "Decision To Treat to Treatment"<br />
February 2011<br />
Apr-09 May-09 Jun-09 Jul-09 Aug-09 Sep-09 Oct-09 Nov-09 Dec-09 Jan-10 Feb-10 Mar-10 YTD<br />
Number First Treated 226 208 259 268 245 240 280 272 222 272 257 275 3024<br />
Number of Breaches 4 5 7 6 7 15 4 5 4 9 0 4 70<br />
Number of Breaches excluding patient choice,<br />
medical reasons & complex diagnostic pathways<br />
1 3 2 5 6 13 0 0 0 7 0 2 39<br />
Performance 98.2% 97.6% 97.3% 97.8% 97.1% 93.8% 98.6% 98.2% 98.2% 96.7% 100.0% 98.5% 97.7%<br />
DOH Target 96% 96% 96% 96% 96% 96% 96% 96% 96% 96% 96% 96% 96%<br />
Apr-10 May-10 Jun-10 Jul-10 Aug-10 Sep-10 Oct-10 Nov-10 Dec-10 Jan-11 Feb-11 Mar-11 YTD<br />
Number First Treated 264 223 278 276 275 261 248 315 246 298 276 2960<br />
Number of Breaches 8 4 3 0 4 3 5 6 7 9 5 54<br />
Number of Breaches excluding patient choice,<br />
medical reasons & complex diagnostic pathways<br />
6 3 2 0 2 1 4 5 7 6 2 38<br />
Performance 97.0% 98.2% 98.9% 100.0% 98.5% 98.9% 98.0% 98.1% 97.2% 97.0% 98.2% 98.2%<br />
DOH Target 96% 96% 96% 96% 96% 96% 96% 96% 96% 96% 96% 96% 96%<br />
Performance Against Target<br />
300<br />
275<br />
250<br />
225<br />
200<br />
175<br />
150<br />
125<br />
40%<br />
100<br />
30%<br />
75<br />
20%<br />
50<br />
25<br />
10%<br />
0<br />
0%<br />
Apr-07 Jun-07 Aug-07 Oct-07 Dec-07 Feb-08 Apr-08 Jun-08 Aug-08 Oct-08 Dec-08 Feb-09 Apr-09 Jun-09 Aug-09 Oct-09 Dec-09 Feb-10 Apr-10 Jun-10 Aug-10 Oct-10 Dec-10 Feb-11<br />
Month<br />
Number of Patients <strong>Trust</strong> Performance DOH Target<br />
100%<br />
90%<br />
80%<br />
70%<br />
60%<br />
50%<br />
Breaches<br />
Patient Choice 1<br />
Medical Reasons 2<br />
Outpatient Capacity<br />
Administration delay 1<br />
Inpatient Capacity<br />
Cancellation for non medical reasons 1<br />
Delay in diganostics<br />
Failure in clinical pathway<br />
Delay due to referral between <strong>Trust</strong>s<br />
TOTAL 5<br />
Patient Choice<br />
Medical Reasons<br />
Outpatient Capacity<br />
Administration delay<br />
Inpatient Capacity<br />
Cancellation for non medical<br />
reasons<br />
Delay in diganostics<br />
Failure in clinical pathway<br />
Delay due to referral between <strong>Trust</strong>s<br />
Page 35
CANCER TARGETS : 62 Day "GP Urgent referral to Treatment"<br />
February 2011<br />
Apr-09 May-09 Jun-09 Jul-09 Aug-09 Sep-09 Oct-09 Nov-09 Dec-09 Jan-10 Feb-10 Mar-10 YTD<br />
Number First Treated 112.0 83.5 107.0 132.5 123.5 110.5 137.0 123.5 107.5 127.5 106.0 135.0 1405.5<br />
Number of Breaches 12.0 16.0 18.0 21.0 17.0 19.0 17.0 18.5 14.0 20.0 24.0 14.0 210.5<br />
Number of Breaches excluding patient choice,<br />
medical reasons & complex diagnostic<br />
pathways<br />
7.0 4.5 7.5 7.5 10.5 14.0 0.0 0.0 0.0 5.5 7.0 4.5 68.0<br />
Performance 89.3% 80.8% 83.2% 84.2% 86.2% 82.8% 87.6% 85.0% 87.0% 84.3% 77.4% 89.6% 85.0%<br />
DOH Target 85% 85% 85% 85% 85% 85% 85% 85% 85% 85% 85% 85% 85%<br />
Apr-10 May-10 Jun-10 Jul-10 Aug-10 Sep-10 Oct-10 Nov-10 Dec-10 Jan-11 Feb-11 Mar-11 YTD<br />
Number First Treated 121.0 98.0 116.0 106.5 143.0 125.0 118.0 129.5 102.0 132.0 123.0 1314.0<br />
Number of Breaches 14.5 12.5 20.0 11.5 18.5 18.5 20.5 17.0 14.0 10.5 17.0 174.5<br />
Number of Breaches excluding patient choice,<br />
medical reasons & complex diagnostic<br />
pathways<br />
7.0 3.0 5.5 2.0 8.5 7.0 4.0 2.0 2.5 3.0 4.0 48.5<br />
Performance 88.0% 87.2% 82.8% 89.2% 87.1% 85.2% 82.6% 86.9% 86.3% 92.0% 86.2% 86.7%<br />
DOH Target 85% 85% 85% 85% 85% 85% 85% 85% 85% 85% 85% 85% 85%<br />
Performance Against Target<br />
160<br />
140<br />
120<br />
100<br />
80<br />
60<br />
40<br />
20<br />
100%<br />
90%<br />
80%<br />
70%<br />
60%<br />
50%<br />
40%<br />
30%<br />
20%<br />
10%<br />
0<br />
0%<br />
Apr-07 Jun-07 Aug-07 Oct-07 Dec-07 Feb-08 Apr-08 Jun-08 Aug-08 Oct-08 Dec-08 Feb-09 Apr-09 Jun-09 Aug-09 Oct-09 Dec-09 Feb-10 Apr-10 Jun-10 Aug-10 Oct-10 Dec-10 Feb-11<br />
Month<br />
Number of Patients <strong>Trust</strong> Performance DOH Target<br />
Breaches<br />
Patient Choice 8<br />
Medical Reasons 2<br />
Complex Diagnostic Pathway 3<br />
Outpatient Capacity 1<br />
Administration delay<br />
Inpatient Capacity<br />
Cancellation for non medical reasons 2<br />
Delay in diganostics<br />
Failure in clinical pathway 1<br />
Delay due to referral between <strong>Trust</strong>s<br />
Unknown<br />
TOTAL 17<br />
Patient Choice<br />
Medical Reasons<br />
Complex Diagnostic Pathway<br />
Outpatient Capacity<br />
Administration delay<br />
Inpatient Capacity<br />
Cancellation for non medical reasons<br />
Delay in diganostics<br />
Failure in clinical pathway<br />
Delay due to referral between <strong>Trust</strong>s<br />
Unknown<br />
Page 36
GFOCW TARGETS : 62 Days from Screening Referrals to First Treatment<br />
February 2011<br />
Standard - Maximum 62 days from referral from NHS Cancer Screening Programmes (breast, cervical and bowel) to first treatment for patients first treated<br />
January 2009 onwards<br />
Month Apr-09 May-09 Jun-09 Jul-09 Aug-09 Sep-09 Oct-09 Nov-09 Dec-09 Jan-10 Feb-10 Mar-10 YTD<br />
Number of Patients 8 8 24 7 8 15 14 19 15 18 17 16 169<br />
Number of Breaches 0 1 3 2 0 1 2 1 0 2 0 0 12<br />
Number of Breaches excluding patient cho 0 1 1 0 0 0 0 0 0 0 0 0 2<br />
% Performance Against Target 100.0% 87.5% 87.5% 71.4% 100.0% 93.3% 85.7% 94.7% 100.0% 88.9% 100.0% 100.0% 92.9%<br />
DOH Target 90% 90% 90% 90% 90% 90% 90% 90% 90% 90% 90% 90% 90%<br />
Month Apr-10 May-10 Jun-10 Jul-10 Aug-10 Sep-10 Oct-10 Nov-10 Dec-10 Jan-11 Feb-11 Mar-11 YTD<br />
Number of Patients 7.0 19.0 14.5 13.5 17.0 13.0 11.5 21.0 7.0 15.0 16.5 155<br />
Number of Breaches 1.0 2.0 0.0 0.5 0.0 1.0 3.5 0.0 2.0 1.0 2.0 13<br />
Number of Breaches excluding patient<br />
choice, medical reasons & complex<br />
diagnostic pathways<br />
0.0 0.0 0.0 0.0 0.0 0.0 2.0 0.0 0.0 0.0 0.0 2<br />
% Performance Against Target 85.7% 89.5% 100.0% 96.3% 100.0% 92.3% 69.6% 100.0% 71.4% 93.3% 87.9% 91.6%<br />
DOH Target 90% 90% 90% 90% 90% 90% 90% 90% 90% 90% 90% 90% 90%<br />
30<br />
25<br />
20<br />
15<br />
10<br />
5<br />
0<br />
0%<br />
Apr-08 Jun-08 Aug-08 Oct-08 Dec-08 Feb-09 Apr-09 Jun-09 Aug-09 Oct-09 Dec-09 Feb-10 Apr-10 Jun-10 Aug-10 Oct-10 Dec-10 Feb-11<br />
100%<br />
90%<br />
80%<br />
70%<br />
60%<br />
50%<br />
40%<br />
30%<br />
20%<br />
10%<br />
Number Treated % Against Target DOH Target<br />
February 2011<br />
GFOCW TARGETS : 62 Days from Consultant Upgrade to First Treatment<br />
Standard - Maximum 62 days from consultant upgrade of urgency of a referral to first treatment for patients treated Jan 2009 onwards<br />
Month Apr-09 May-09 Jun-09 Jul-09 Aug-09 Sep-09 Oct-09 Nov-09 Dec-09 Jan-10 Feb-10 Mar-10 YTD<br />
Number of Patients 7.0 13.0 13.0 5.0 6.0 17.0 7.0 14.0 15.5 13.0 13.0 16.0 139.5<br />
Number of Breaches 2.0 0.0 1.0 1.0 1.0 4.0 1.0 1.0 2.0 1.5 0.0 1.0 15.5<br />
Number of Breaches excluding patient cho 1.0 0.0 0.0 0.0 0.0 4.0 0.0 0.0 0.0 0.0 0.0 0.0 5.0<br />
% Performance Against Target 71.4% 100.0% 92.3% 80.0% 83.3% 76.5% 85.7% 92.9% 87.1% 88.5% 100.0% 93.8% 88.9%<br />
Possible DOH Target 85% 85% 85% 85% 85% 85% 85% 85% 85% 85% 85% 85% 85%<br />
Month Apr-10 May-10 Jun-10 Jul-10 Aug-10 Sep-10 Oct-10 Nov-10 Dec-10 Jan-11 Feb-11 Mar-11 YTD<br />
Number of Patients 7.0 10.0 19.0 13.0 10.5 10.0 10.5 14.0 8.0 15.5 19.5 137.0<br />
Number of Breaches 0.0 1.0 1.0 1.0 1.0 2.0 1.0 2.0 1.0 1.0 2.0 13.0<br />
Number of Breaches excluding patient<br />
choice, medical reasons & complex<br />
diagnostic pathways<br />
0.0 0.0 0.0 1.0 1.0 0.0 1.0 0.0 1.0 0.0 0.0 4.0<br />
% Performance Against Target 100.0% 90.0% 94.7% 92.3% 90.5% 80.0% 90.5% 85.7% 87.5% 93.5% 89.7% 90.5%<br />
Possible DOH Target 85% 85% 85% 85% 85% 85% 85% 85% 85% 85% 85% 85% 85%<br />
NB: The target for 62 Days from Consultant Upgrade to First Treatment has been set at 85% as per the Monitor target, currently<br />
the CQC has not issued a target due to lack of data nationally<br />
25<br />
20<br />
15<br />
10<br />
5<br />
0<br />
0%<br />
Apr-08 Jun-08 Aug-08 Oct-08 Dec-08 Feb-09 Apr-09 Jun-09 Aug-09 Oct-09 Dec-09 Feb-10 Apr-10 Jun-10 Aug-10 Oct-10 Dec-10 Feb-11<br />
100%<br />
90%<br />
80%<br />
70%<br />
60%<br />
50%<br />
40%<br />
30%<br />
20%<br />
10%<br />
Number Treated % Against Target Possible DOH Target<br />
Page 37
GFOCW TARGETS : 31 Days from Decision to Treatment to Treatment for Subsequent Treatments of Surgery or Anti Cancer<br />
Drugs<br />
Surgery<br />
February 2011<br />
Standard - Maximum 31 days from decision to treat/earliest clinically appropriate date to start of second or subsequent treatment(s) for all cancer patients including those<br />
diagnosed with recurrence for treatments Jan 2009 onwards and where the treatment is surgery or anti cancer drug treatment<br />
Month Apr-09 May-09 Jun-09 Jul-09 Aug-09 Sep-09 Oct-09 Nov-09 Dec-09 Jan-10 Feb-10 Mar-10 YTD<br />
Number of Patients 63 56 64 84 60 63 79 92 79 83 88 98 909<br />
Number of Breaches 5 2 6 6 12 12 2 3 8 2 2 2 62<br />
Number of Breaches excluding patient<br />
choice, medical reasons & complex<br />
diagnostic pathways<br />
5 1 5 5 12 11 0 0 0 2 2 1 44<br />
% Performance Against Target 92.1% 96.4% 90.6% 92.9% 80.0% 81.0% 97.5% 96.7% 89.9% 97.6% 97.7% 98.0% 93.2%<br />
DOH Target 94% 94% 94% 94% 94% 94% 94% 94% 94% 94% 94% 94% 94%<br />
Month Apr-10 May-10 Jun-10 Jul-10 Aug-10 Sep-10 Oct-10 Nov-10 Dec-10 Jan-11 Feb-11 Mar-11 YTD<br />
Number of Patients 68 90 78 102 76 96 103 102 78 76 73 942<br />
Number of Breaches 8 0 2 3 3 5 2 3 2 0 0 28<br />
Number of Breaches excluding patient<br />
choice, medical reasons & complex<br />
diagnostic pathways<br />
8 0 2 2 2 5 2 3 2 0 0 26<br />
% Performance Against Target 88.2% 100.0% 97.4% 97.1% 96.1% 94.8% 98.1% 97.1% 97.4% 100.0% 100.0% 97.0%<br />
DOH Target 94% 94% 94% 94% 94% 94% 94% 94% 94% 94% 94% 94% 94%<br />
120<br />
100<br />
80<br />
60<br />
40<br />
20<br />
100%<br />
80%<br />
60%<br />
40%<br />
20%<br />
0<br />
0%<br />
Apr-08 Jun-08 Aug-08 Oct-08 Dec-08 Feb-09 Apr-09 Jun-09 Aug-09 Oct-09 Dec-09 Feb-10 Apr-10 Jun-10 Aug-10 Oct-10 Dec-10 Feb-11<br />
Number Treated % Against Target DOH Target<br />
Anti Cancer Drugs<br />
Month Apr-09 May-09 Jun-09 Jul-09 Aug-09 Sep-09 Oct-09 Nov-09 Dec-09 Jan-10 Feb-10 Mar-10 YTD<br />
Number of Patients 67 69 92 90 78 75 81 81 40 86 81 47 887<br />
Number of Breaches 2 0 0 0 0 0 1 0 0 4 0 0 7<br />
Number of Breaches excluding patient<br />
choice, medical reasons & complex<br />
diagnostic pathways<br />
2 0 0 0 0 0 0 0 0 3 0 0 5<br />
% Performance Against Target 97.0% 100.0% 100.0% 100.0% 100.0% 100.0% 100.0% 100.0% 100.0% 96.5% 100.0% 100.0% 99.4%<br />
DOH Target 98% 98% 98% 98% 98% 98% 98% 98% 98% 98% 98% 98% 98%<br />
Month Apr-10 May-10 Jun-10 Jul-10 Aug-10 Sep-10 Oct-10 Nov-10 Dec-10 Jan-11 Feb-11 Mar-11 YTD<br />
Number of Patients 79 105 83 70 82 93 95 105 59 84 81 936<br />
Number of Breaches 0 0 0 0 0 0 0 0 0 0 0 0<br />
Number of Breaches excluding patient<br />
choice, medical reasons & complex<br />
diagnostic pathways<br />
0 0 0 0 0 0 0 0 0 0 0 0<br />
% Performance Against Target 100.0% 100.0% 100.0% 100.0% 100.0% 100.0% 100.0% 100.0% 100.0% 100.0% 100.0% 100.0%<br />
DOH Target 98% 98% 98% 98% 98% 98% 98% 98% 98% 98% 98% 98% 98%<br />
100%<br />
90<br />
80%<br />
75<br />
60<br />
CHART<br />
60%<br />
45<br />
40%<br />
30<br />
15<br />
20%<br />
0<br />
0%<br />
Apr-08 Jun-08 Aug-08 Oct-08 Dec-08 Feb-09 Apr-09 Jun-09 Aug-09 Oct-09 Dec-09 Feb-10 Apr-10 Jun-10 Aug-10 Oct-10 Dec-10 Feb-11<br />
Number Treated % Against Target DOH Target<br />
Page 38
GFOCW TARGETS : 2 Week Wait for Breast Symptom Referrals<br />
February 2011<br />
Standard - Maximum 2 week wait from referral for general breast symptoms (where cancer is initially not suspected) to date first seen from Jan 2010 onwards<br />
Month Apr-09 May-09 Jun-09 Jul-09 Aug-09 Sep-09 Oct-09 Nov-09 Dec-09 Jan-10 Feb-10 Mar-10 Q4<br />
Number of Patients 79 97 118 82 97 83 78 85 73 122 164 139 425<br />
Number of Breaches 72 72 79 42 41 15 10 6 8 14 17 6 37<br />
Number of Breaches excluding<br />
patient choice<br />
N/A N/A N/A N/A N/A 5 7 1 0 0 0 0 0<br />
% Performance Against Target 8.9% 25.8% 33.1% 48.8% 57.7% 81.9% 87.2% 92.9% 89.0% 88.5% 89.6% 95.7% 91.3%<br />
DOH Target 93% 93% 93% 93% 93% 93% 93% 93% 93% 93% 93% 93% 93%<br />
Month Apr-10 May-10 Jun-10 Jul-10 Aug-10 Sep-10 Oct-10 Nov-10 Dec-10 Jan-11 Feb-11 Mar-11 YTD<br />
Number of Patients 124 135 157 128 171 128 138 181 141 133 102 1538<br />
Number of Breaches 12 1 2 3 0 1 1 2 2 6 3 33<br />
Number of Breaches excluding<br />
patient choice<br />
0 0 0 0 0 0 0 0 0 0 0 0<br />
% Performance Against Target 90.3% 99.3% 98.7% 97.7% 100.0% 99.2% 99.3% 98.9% 98.6% 95.5% 97.1% 97.9%<br />
DOH Target 93% 93% 93% 93% 93% 93% 93% 93% 93% 93% 93% 93% 93%<br />
200<br />
100%<br />
175<br />
90%<br />
80%<br />
150<br />
70%<br />
125<br />
60%<br />
100<br />
50%<br />
75<br />
40%<br />
30%<br />
50<br />
20%<br />
25<br />
10%<br />
0<br />
0%<br />
Apr-08 Jun-08 Aug-08 Oct-08 Dec-08 Feb-09 Apr-09 Jun-09 Aug-09 Oct-09 Dec-09 Feb-10 Apr-10 Jun-10 Aug-10 Oct-10 Dec-10 Feb-11<br />
Number 1st Seen % Against Target DOH Target<br />
GFOCW TARGETS : 31 Days from Decision to Treatment to Treatment for Subsequent Treatments of Radiotherapy<br />
February 2011<br />
Standard - Maximum 31 days from decision to treat/earliest clinically appropriate date to start of second or subsequent treatment(s) for all cancer patients including those<br />
diagnosed with recurrence for treatments Jan 2011 onwards and where the treatment is radiotherapy<br />
Month Apr-09 May-09 Jun-09 Jul-09 Aug-09 Sep-09 Oct-09 Nov-09 Dec-09 Jan-10 Feb-10 Mar-10 YTD<br />
Number of Patients 86 81 93 76 80 89 74 84 67 94 80 83 987<br />
Number of Breaches 2 2 1 4 5 11 2 10 6 9 2 1 55<br />
Number of Breaches excluding<br />
patient choice, medical reasons & 1 1 0 1 2 8 0 0 0 9 1 1 24<br />
complex diagnostic pathways<br />
% Performance Against Target 97.7% 97.5% 98.9% 94.7% 93.8% 87.6% 97.3% 88.1% 91.0% 90.4% 97.5% 98.8% 94.4%<br />
DOH Target 94% 94% 94% 94% 94% 94% 94% 94% 94% 94% 94% 94% 94%<br />
Month Apr-10 May-10 Jun-10 Jul-10 Aug-10 Sep-10 Oct-10 Nov-10 Dec-10 Jan-11 Feb-11 Mar-11 YTD<br />
Number of Patients 79 86 91 83 63 89 72 95 75 88 74 895<br />
Number of Breaches 10 5 2 1 1 3 3 3 1 5 1 35<br />
Number of Breaches excluding<br />
patient choice, medical reasons & 9 3 1 0 1 1 1 1 0 1 0 18<br />
complex diagnostic pathways<br />
% Performance Against Target 87.3% 94.2% 97.8% 98.8% 98.4% 96.6% 95.8% 96.8% 98.7% 94.3% 98.6% 96.1%<br />
DOH Target 94% 94% 94% 94% 94% 94% 94% 94% 94% 94% 94% 94% 94%<br />
125<br />
100%<br />
90%<br />
100<br />
80%<br />
70%<br />
75<br />
60%<br />
50%<br />
50<br />
40%<br />
30%<br />
25<br />
20%<br />
10%<br />
0<br />
0%<br />
Apr-08 Jun-08 Aug-08 Oct-08 Dec-08 Feb-09 Apr-09 Jun-09 Aug-09 Oct-09 Dec-09 Feb-10 Apr-10 Jun-10 Aug-10 Oct-10 Dec-10 Feb-11<br />
Number 1st Treated % Against Target DOH Target<br />
Page 39
CANCER TARGETS : Breach Analysis<br />
February 2011<br />
Patient Choice<br />
Medical Reasons<br />
Complex clinical pathway<br />
Outpatient Capacity<br />
Administration delay<br />
Inpatient Capacity<br />
Cancellation for non medical reasons<br />
Delay in diagnostics<br />
Failure in clinical pathway<br />
Delay due to referral between <strong>Trust</strong>s<br />
Unknown<br />
TOTAL<br />
2ww<br />
31 Day First<br />
Treatment<br />
62 Day 2ww to<br />
Treatment<br />
43 1 8<br />
2 2<br />
3<br />
1<br />
1<br />
1<br />
2<br />
1<br />
43 5 17<br />
Breaches<br />
highlighted in<br />
green are<br />
beyond <strong>Trust</strong><br />
control<br />
Patient Choice<br />
Medical Reasons<br />
Complex clinical pathway<br />
Outpatient Capacity<br />
Administration delay<br />
Inpatient Capacity<br />
Cancellation for non medical reasons<br />
Delay in diagnostics<br />
Failure in clinical pathway<br />
Delay due to referral between <strong>Trust</strong>s<br />
Unknown<br />
TOTAL<br />
Screening<br />
Consultant<br />
Upgrades Sub Surgery Sub Chemo<br />
Breast<br />
Symptom<br />
Sub<br />
Radiotherapy<br />
2 1 3 1<br />
1<br />
2 2 0 0 3 1<br />
Page 40
Reperfusion Waiting Times<br />
Current Month:<br />
February 2011<br />
PART 1<br />
Thrombolysis - 60 minutes call to needle time<br />
Number of patients eligible for thrombolysis<br />
Number of patients receiving thrombolysis within 60<br />
mins of call for help<br />
% Achievement of Call to Needle Target<br />
Target<br />
Apr-09 May-09 Jun-09 Jul-09 Aug-09 Sep-09 Oct-09 Nov-09 Dec-09 Jan-10 Feb-10 Mar-10 YTD<br />
3 11 3 5 4 5 31<br />
3 7 3 4 2 3 22<br />
100% 64% 100% 80% 50% 60% N/A N/A N/A N/A N/A N/A 71%<br />
68% 68% 68% 68% 68% 68% 68% 68% 68% 68% 68% 68% 68%<br />
100%<br />
80%<br />
60%<br />
40%<br />
20%<br />
0%<br />
% Thrombolysed (Call To Needle)<br />
Apr-06<br />
May-06<br />
Jun-06<br />
Jul-06<br />
Aug-06<br />
Sep-06<br />
Oct-06<br />
Nov-06<br />
Dec-06<br />
Jan-07<br />
Feb-07<br />
Mar-07<br />
Apr-07<br />
May-07<br />
Jun-07<br />
Jul-07<br />
Aug-07<br />
Sep-07<br />
Oct-07<br />
Nov-07<br />
Dec-07<br />
Jan-08<br />
Feb-08<br />
Mar-08<br />
Apr-08<br />
May-08<br />
Jun-08<br />
Jul-08<br />
Aug-08<br />
Sep-08<br />
Oct-08<br />
Nov-08<br />
Dec-08<br />
Jan-09<br />
Feb-09<br />
Mar-09<br />
Apr-09<br />
May-09<br />
Jun-09<br />
Jul-09<br />
Aug-09<br />
Sep-09<br />
Oct-09<br />
Nov-09<br />
Dec-09<br />
Jan-10<br />
Feb-10<br />
Mar-10<br />
Apr-10<br />
% Actual % National Target<br />
PART 2<br />
Primary PCI - 150 minutes call to first balloon inflation<br />
NB Primary PCI service started October 2009<br />
Number of patients eligible for pPCI<br />
Number of patients receiving pPCI within 150 mins of<br />
call for help<br />
% Achievement of Call to Balloon Target<br />
Target<br />
Number of patients eligible for pPCI<br />
Number of patients receiving pPCI within 150 mins of<br />
call for help<br />
% Achievement of Call to Balloon Target<br />
Target<br />
Number of patients eligible for pPCI<br />
Number of patients receiving pPCI within 150 mins of<br />
% Achievement of Call to Balloon Target<br />
Target<br />
Jan-09 Feb-09 Mar-09 Apr-09 May-09 Jun-09 Jul-09 Aug-09 Sep-09 Oct-09 Nov-09 Dec-09 YTD<br />
14 14 10 38<br />
12 12 7<br />
31<br />
86% 86% 70% 82%<br />
75% 75% 75% 75% 75% 75% 75% 75% 75% 75% 75% 75% 75%<br />
Jan-10 Feb-10 Mar-10 Apr-10 May-10 Jun-10 Jul-10 Aug-10 Sep-10 Oct-10 Nov-10 Dec-10 YTD<br />
7 10 6 8 12 10 8 11 12 12 10 14 120<br />
7 9 5 6 10 8 6 8 8 8 8 13 96<br />
100% 90% 83% 75% 83% 80% 75% 73% 67% 67% 80% 93% 80%<br />
75% 75% 75% 75% 75% 75% 75% 75% 75% 75% 75% 75% 75%<br />
Jan-11 Feb-11 Mar-11 Apr-11 May-11 Jun-11 Jul-11 Aug-11 Sep-11 Oct-11 Nov-11 Dec-11 YTD<br />
10 12 22<br />
7 11 18<br />
70% 92% 82%<br />
75% 75% 75% 75% 75% 75% 75% 75% 75% 75% 75% 75% 75%<br />
100%<br />
80%<br />
60%<br />
40%<br />
20%<br />
0%<br />
Apr-09 May-09 Jun-09 Jul-09 Aug-09 Sep-09 Oct-09 Nov-09 Dec-09 Jan-10 Feb-10 Mar-10 Apr-10 May-10 Jun-10 Jul-10 Aug-10 Sep-10 Oct-10 Nov-10 Dec-10 Jan-11 Feb-11<br />
Actual Monthly<br />
National Target<br />
NB Primary PCI service started October 2009<br />
PART 3<br />
Primary PCI - 150 minutes call to first balloon inflation 3 months rolling percentage<br />
Number of patients eligible for pPCI<br />
Number of patients receiving pPCI within 150 mins of<br />
% Achievement of Call to Balloon Target<br />
Target<br />
Number of patients eligible for pPCI<br />
Number of patients receiving pPCI within 150 mins of<br />
% Achievement of Call to Balloon Target<br />
Target<br />
Number of patients eligible for pPCI<br />
Number of patients receiving pPCI within 150 mins of<br />
% Achievement of Call to Balloon Target<br />
Target<br />
Jan-09 Feb-09 Mar-09 Apr-09 May-09 Jun-09 Jul-09 Aug-09 Sep-09 Oct-09 Nov-09 Dec-09 YTD<br />
14 14 10 38<br />
12 12 7 31<br />
82% 82%<br />
75% 75% 75% 75% 75% 75% 75% 75% 75% 75% 75% 75% 75%<br />
Jan-10 Feb-10 Mar-10 Apr-10 May-10 Jun-10 Jul-10 Aug-10 Sep-10 Oct-10 Nov-10 Dec-10 YTD<br />
7 10 6 8 12 10 8 11 12 12 10 14 120<br />
7 9 5 6 10 8 6 8 8 8 8 13 96<br />
84% 85% 91% 83% 81% 80% 80% 76% 71% 69% 71% 81% 80%<br />
75% 75% 75% 75% 75% 75% 75% 75% 75% 75% 75% 75% 75%<br />
Jan-11 Feb-11 Mar-11 Apr-11 May-11 Jun-11 Jul-11 Aug-11 Sep-11 Oct-11 Nov-11 Dec-11 YTD<br />
10 12 22<br />
7 11 18<br />
82% 86% 0% 0% 0% 0% 0% 0% 0% 0% 0% 0% 82%<br />
75% 75% 75% 75% 75% 75% 75% 75% 75% 75% 75% 75% 75%<br />
100%<br />
80%<br />
60%<br />
40%<br />
20%<br />
0%<br />
Apr-09 May-09 Jun-09 Jul-09 Aug-09 Sep-09 Oct-09 Nov-09 Dec-09 Jan-10 Feb-10 Mar-10 Apr-10 May-10 Jun-10 Jul-10 Aug-10 Sep-10 Oct-10 Nov-10 Dec-10 Jan-11 Feb-11<br />
3 Months Rolling National Target<br />
Page 41
EFFICIENCY AND BUSINESS<br />
MANAGEMENT OBJECTIVE<br />
PERFORMANCE REPORT<br />
Page 42
PLYMOUTH HOSPITALS NHS TRUST <strong>Trust</strong> performance report - February 2011 Table 1<br />
Income and Expenditure Performance against plan<br />
2<br />
<strong>Trust</strong> surplus against plan<br />
0<br />
Plan<br />
-2<br />
£m<br />
-4<br />
-6<br />
Actual<br />
-8<br />
-10<br />
-12<br />
Apr-10 May-10 Jun-10 Jul-10 Aug-10 Sep-10 Oct-10 Nov-10 Dec-10 Jan-11 Feb-11 Mar-11<br />
Month<br />
Revised Plan<br />
Current Month<br />
Year to Date<br />
Year to Date<br />
Annual<br />
Budget<br />
Actual<br />
Variance -<br />
Adverse/<br />
(Favourable)<br />
Original Budget<br />
Actual<br />
Variance -<br />
Adverse/<br />
(Favourable)<br />
Revised Plan<br />
Actual<br />
Variance -<br />
Adverse/<br />
(Favourable)<br />
Budget<br />
Revised Plan<br />
Variance -<br />
Adverse/<br />
(Favourable)<br />
£000 £000 £000 £000 £000 £000 £000 £000 £000 £000 £000 £000<br />
OPERATIONAL PERFORMANCE<br />
INCOME<br />
Provision of healthcare (25,953) (27,696) (1,743) (297,462) (308,704) (11,242) (307,502) (308,704) (1,202) (326,004) (339,252) (13,248)<br />
Education, training and research (1,880) (1,661) 219 (20,669) (24,084) (3,415) (23,536) (24,084) (548) (22,550) (25,679) (3,129)<br />
Other Income (1,610) (3,079) (1,469) (17,746) (20,420) (2,674) (19,689) (20,420) (732) (19,396) (21,857) (2,461)<br />
TOTAL INCOME (29,443) (32,435) (2,992) (335,877) (353,208) (17,331) (350,727) (353,208) (2,482) (367,951) (386,788) (18,837)<br />
EXPENDITURE<br />
Pay 19,329 19,513 183 213,534 216,839 3,305 215,611 216,839 1,228 232,871 234,556 1,686<br />
Non-pay 9,487 10,510 1,023 107,781 116,954 9,173 113,947 116,954 3,007 117,910 124,348 6,439<br />
TOTAL EXPENDITURE 28,816 30,023 1,207 321,315 333,793 12,479 329,558 333,793 4,235 350,780 358,904 8,124<br />
RESERVES 0 0 0 0 0 (0) 2,222 0 (2,222) 321 2,643 2,322<br />
CIPS IDENTIFIED BUT NOT YET TRANSFERRED<br />
NET (SURPLUS)/DEFICIT BEFORE DEPRECIATION<br />
AND INTEREST<br />
(931) 0 931 (7,625) 0 7,625 0 0 0 (8,536) 0 8,536<br />
(1,558) (2,413) (855) (22,188) (19,415) 2,772 (18,946) (19,415) (469) (25,386) (25,240) 145<br />
Depreciation Charges 1,429 1,560 131 15,721 16,146 425 16,395 16,146 (248) 17,150 17,926 776<br />
Impairments 0 0 0 0 0 0 0 0 0 0 0 0<br />
Profit/Loss on Asset Disposal 0 (8) (8) 58 233 175 139 233 94 58 139 81<br />
Interest Payable 14 13 (1) 150 151 1 150 151 0 164 164 0<br />
Interest Receivable (3) (2) 1 (28) (25) 3 (29) (25) 4 (30) (31) (1)<br />
<strong>Public</strong> Dividend Capital Interest 587 587 (0) 6,456 6,455 (1) 6,456 6,455 (1) 7,043 7,043 0<br />
TOTAL DEPRECIATION AND INTEREST 2,027 2,150 122 22,358 22,961 603 23,111 22,961 (150) 24,386 25,241 855<br />
NET (SURPLUS)/DEFICIT 469 (263) (732) 171 3,546 3,375 4,165 3,546 (619) (1,000) 0 1,001<br />
Page 43
HEALTH OBJECTIVE<br />
PERFORMANCE REPORT<br />
Page 44
8<br />
Access to GUM clinics - Offered to be Seen within 48 Hours<br />
Current Month:<br />
February 2011 Target = Achieve 100% by 2008<br />
Mar-10<br />
Apr-10<br />
May-10<br />
Jun-10<br />
Jul-10<br />
Aug-10<br />
No. Seen who were<br />
offered to be seen 1124 1061 935 1018 1177 1130 1213 1006 1059 839 1052 1171 11661<br />
within 48 hrs<br />
No. New Attending 1124 1061 935 1018 1177 1130 1213 1006 1059 839 1052 1172 11662<br />
% Seen who were<br />
Offered to be seen<br />
within 48 hrs<br />
100% 100% 100% 100% 100% 100% 100% 100% 100% 100% 100% 100% 100%<br />
Sep-10<br />
Oct-10<br />
Nov-10<br />
Dec-10<br />
Jan-11<br />
Feb-11<br />
Mar-11<br />
2010/11<br />
YTD<br />
100%<br />
95%<br />
90%<br />
85%<br />
80%<br />
75%<br />
70%<br />
65%<br />
60%<br />
No. Seen who were offered to be seen within 48 hrs of Contacting Service<br />
Apr-07<br />
Jun-07<br />
Aug-07<br />
Oct-07<br />
Dec-07<br />
Feb-08<br />
Apr-08<br />
Jun-08<br />
Aug-08<br />
Oct-08<br />
Dec-08<br />
Feb-09<br />
Apr-09<br />
Jun-09<br />
Aug-09<br />
Oct-09<br />
Dec-09<br />
Feb-10<br />
Apr-10<br />
Jun-10<br />
Aug-10<br />
Oct-10<br />
Dec-10<br />
Feb-11<br />
9<br />
Access to GUM clinics - Seen within 48 Hours<br />
Current Month:<br />
February 2011<br />
Mar-10<br />
Apr-10<br />
May-10<br />
Jun-10<br />
Jul-10<br />
Aug-10<br />
No. Seen within 48<br />
hrs<br />
1037 973 845 937 1049 1022 1105 898 987 783 951 1055 10605<br />
No. New Attending 1124 1061 935 1018 1177 1130 1213 1006 1059 839 1052 1172 11662<br />
% Seen within 48<br />
Hours<br />
92% 92% 90% 92% 89% 90% 91% 89% 93% 93% 90% 90% 91%<br />
Sep-10<br />
Oct-10<br />
Nov-10<br />
Dec-10<br />
Jan-11<br />
Feb-11<br />
Mar-11<br />
2010/11<br />
YTD<br />
100%<br />
No. Seen within 48 hrs of Contacting Service<br />
90%<br />
80%<br />
70%<br />
60%<br />
50%<br />
40%<br />
Mar-08<br />
Apr-08<br />
May-08<br />
Jun-08<br />
Jul-08<br />
Aug-08<br />
Sep-08<br />
Oct-08<br />
Nov-08<br />
Dec-08<br />
Jan-09<br />
Feb-09<br />
Mar-09<br />
Apr-09<br />
May-09<br />
Jun-09<br />
Jul-09<br />
Aug-09<br />
Sep-09<br />
Oct-09<br />
Nov-09<br />
Dec-09<br />
Jan-10<br />
Feb-10<br />
Mar-10<br />
Apr-10<br />
May-10<br />
Jun-10<br />
Jul-10<br />
Aug-10<br />
Sep-10<br />
Oct-10<br />
Nov-10<br />
Dec-10<br />
Jan-11<br />
Feb-11<br />
Mar-11<br />
Page 45
INFANT HEALTH & INEQUALITIES<br />
#<br />
BREAST FEEDING INITIATION<br />
Data Completeness Indicator<br />
Current Month:<br />
February 2011<br />
Target = To Achieve 100% coverage (must be above 95% for valid<br />
return)<br />
2010/11<br />
2009/10<br />
Apr-10<br />
May-10<br />
Jun-10<br />
Jul-10<br />
Aug-10<br />
No. of Maternities with<br />
Breast Feeding Status 4533 351 351 397 388 348 371 420 377 429 379 392 0 4203<br />
Known<br />
No. of Maternities 4739 366 379 421 397 377 380 438 389 441 394 395 0 4377<br />
% Completeness 96% 96% 93% 94% 98% 92% 98% 96% 97% 97% 96% 99% 96%<br />
Sep-10<br />
Oct-10<br />
Nov-10<br />
Dec-10<br />
Jan-11<br />
Feb-11<br />
Mar-11<br />
YTD<br />
100%<br />
% of Maternity Episodes with Breast Feeding Status Known<br />
90%<br />
80%<br />
70%<br />
60%<br />
50%<br />
Apr-09<br />
May-09<br />
Jun-09<br />
Jul-09<br />
Aug-09<br />
Sep-09<br />
Oct-09<br />
Nov-09<br />
Dec-09<br />
Jan-10<br />
Feb-10<br />
Mar-10<br />
Apr-10<br />
May-10<br />
Jun-10<br />
Jul-10<br />
Aug-10<br />
Sep-10<br />
Oct-10<br />
Nov-10<br />
Dec-10<br />
Jan-11<br />
Feb-11<br />
Mar-11<br />
Breast Feeding Initiation Rate<br />
Current Month:<br />
February 2011<br />
2010/11<br />
2009/10<br />
Apr-10<br />
May-10<br />
Jun-10<br />
Jul-10<br />
Aug-10<br />
No. of mothers known to<br />
initiate breast feeding 3243 238 243 282 279 231 254 305 284 331 281 299 0 3027<br />
No. of Maternities 4739 366 379 421 397 377 380 438 389 441 394 395 0 4377<br />
% Initiation 68% 65% 64% 67% 70% 61% 67% 70% 73% 75% 71% 76% 69%<br />
Sep-10<br />
Oct-10<br />
Nov-10<br />
Dec-10<br />
Jan-11<br />
Feb-11<br />
Mar-11<br />
YTD<br />
100%<br />
90%<br />
80%<br />
70%<br />
60%<br />
50%<br />
40%<br />
30%<br />
% of Maternity Episodes where Breast Feeding was Initiated<br />
Apr-09<br />
May-09<br />
Jun-09<br />
Jul-09<br />
Aug-09<br />
Sep-09<br />
Oct-09<br />
Nov-09<br />
Dec-09<br />
Jan-10<br />
Feb-10<br />
Mar-10<br />
Apr-10<br />
May-10<br />
Jun-10<br />
Jul-10<br />
Aug-10<br />
Sep-10<br />
Oct-10<br />
Nov-10<br />
Dec-10<br />
Jan-11<br />
Feb-11<br />
Mar-11<br />
Page 46
INFANT HEALTH & INEQUALITIES<br />
#<br />
SMOKING DURING PREGNANCY<br />
Data Completeness<br />
Current Month:<br />
February 2011<br />
Target = To Achieve 100% coverage (must be above 95% for valid<br />
return)<br />
2009/10<br />
2009/10<br />
Apr-10<br />
May-10<br />
Jun-10<br />
Jul-10<br />
Aug-10<br />
No. of Maternities with<br />
Smoking Status Known<br />
4735 366 379 421 397 366 370 429 381 426 385 390 0 4310<br />
No. of Maternities 4739 366 379 421 397 377 380 438 389 441 394 395 0 4377<br />
% Completeness 100% 100% 100% 100% 100% 97% 97% 98% 98% 97% 98% 99% 98%<br />
Sep-10<br />
Oct-10<br />
Nov-10<br />
Dec-10<br />
Jan-11<br />
Feb-11<br />
Mar-11<br />
YTD<br />
100%<br />
99%<br />
98%<br />
97%<br />
96%<br />
95%<br />
94%<br />
93%<br />
92%<br />
91%<br />
90%<br />
% of Maternity Episodes with Smoking Status Known<br />
Apr-09<br />
May-09<br />
Jun-09<br />
Jul-09<br />
Aug-09<br />
Sep-09<br />
Oct-09<br />
Nov-09<br />
Dec-09<br />
Jan-10<br />
Feb-10<br />
Mar-10<br />
Apr-10<br />
May-10<br />
Jun-10<br />
Jul-10<br />
Aug-10<br />
Sep-10<br />
Oct-10<br />
Nov-10<br />
Dec-10<br />
Jan-11<br />
Feb-11<br />
Mar-11<br />
2<br />
"Smokers at Time of Delivery" Rate<br />
Current Month:<br />
February 2011<br />
2009/10<br />
2009/10<br />
Apr-10<br />
May-10<br />
Jun-10<br />
Jul-10<br />
Aug-10<br />
No. of Mothers known to<br />
be Smokers at the Time 836 67 47 70 68 59 62 72 56 88 81 71 0 741<br />
of Delivery<br />
No. of Maternities 4739 366 379 421 397 377 380 438 389 441 394 395 0 4377<br />
% Smokers 18% 18% 12% 17% 17% 16% 16% 16% 14% 20% 21% 18% 17%<br />
Sep-10<br />
Oct-10<br />
Nov-10<br />
Dec-10<br />
Jan-11<br />
Feb-11<br />
Mar-11<br />
YTD<br />
30%<br />
% of Mothers known to be Smokers at Time of Delivery<br />
25%<br />
20%<br />
15%<br />
10%<br />
5%<br />
0%<br />
Apr-09<br />
May-09<br />
Jun-09<br />
Jul-09<br />
Aug-09<br />
Sep-09<br />
Oct-09<br />
Nov-09<br />
Dec-09<br />
Jan-10<br />
Feb-10<br />
Mar-10<br />
Apr-10<br />
May-10<br />
Jun-10<br />
Jul-10<br />
Aug-10<br />
Sep-10<br />
Oct-10<br />
Nov-10<br />
Dec-10<br />
Jan-11<br />
Feb-11<br />
Mar-11<br />
Page 47
#<br />
Current Month:<br />
MATERNITY DATA QUALITY<br />
February 2011<br />
Note : Data is only available from SUS 2 months in arrears<br />
DATA COMPLETENESS<br />
INDICATOR 1 - completeness of<br />
fields<br />
Apr-10<br />
May-10<br />
Jun-10<br />
Jul-10<br />
Aug-10<br />
Sep-10<br />
Oct-10<br />
Nov-10<br />
Dec-10<br />
Jan-11<br />
Feb-11<br />
Mar-11<br />
Data Validity - Birth 95.6% 95.6% 95.7% 95.6% 93.8% 92.1% 90.9% 90.2% 89.5%<br />
Data Validity - Delivery 95.2% 95.2% 96.0% 95.5% 93% 91.2% 90.5% 90.1% 89.6%<br />
2009/2010 CQC Target (minimum<br />
required)<br />
85% 85% 85% 85% 85% 85% 85% 85% 85% 85% 85% 85%<br />
98%<br />
96%<br />
94%<br />
92%<br />
90%<br />
88%<br />
86%<br />
84%<br />
82%<br />
80%<br />
Maternity Data Completeness Indicator<br />
DATA COMPLETENESS<br />
INDICATOR 2 : logic check<br />
between births and deliveries<br />
Apr-10<br />
May-10<br />
Jun-10<br />
Jul-10<br />
Aug-10<br />
Sep-10<br />
Oct-10<br />
Nov-10<br />
01-Apr-<br />
10<br />
01-May-<br />
10<br />
01-Jun-<br />
10<br />
01-Jul-<br />
10<br />
01-Aug-<br />
10<br />
01-Sep-<br />
10<br />
01-Oct-<br />
10<br />
01-Nov-<br />
10<br />
01-Dec-<br />
10<br />
01-Jan-<br />
11<br />
01-Feb-<br />
11<br />
01-Mar-<br />
11<br />
Data Validity - Birth Data Validity - Delivery 2009/2010 CQC Target (minimum required)<br />
Dec-10<br />
Jan-11<br />
Feb-11<br />
Mar-11<br />
Ratio of birth episodes to number<br />
of babies delivered on delivery<br />
episodes - Must be between 0.9<br />
and 1.1<br />
1.209 1.209 1.013 1.006 1.023 1.005 1.021 1.028 1.03<br />
Page 48
PARTICIPATION IN HEART DISEASE AUDITS<br />
Current Month:<br />
February 2011<br />
INDICATOR THRESHOLDS<br />
Part 1 Part 2 Part 1 Part 2 Part 1 Part 2<br />
Achieve 100% 66% Underachieve<br />
50% 25% Fail
#<br />
Current Month:<br />
DATA QUALITY ON ETHNIC GROUP<br />
February 2011<br />
Target = To Achieve 100% coverage<br />
No. of FCEs with Valid<br />
Ethnic Category<br />
2009/10<br />
2010/11<br />
YTD<br />
Apr-10<br />
May-10<br />
Jun-10<br />
Jul-10<br />
Aug-10<br />
134503 121595 11032 10578 11409 11553 11192 11369 11168 11690 10773 10668 10163 0<br />
No. of FCEs 134526 121609 11034 10579 11411 11553 11192 11371 11171 11692 10774 10669 10163 0<br />
% with Valid Ethnic<br />
Category<br />
100% 100% 100% 100% 100% 100% 100% 100% 100% 100% 100% 100% 100% 0%<br />
Sep-10<br />
Oct-10<br />
Nov-10<br />
Dec-10<br />
Jan-11<br />
Feb-11<br />
Mar-11<br />
101%<br />
100%<br />
99%<br />
98%<br />
97%<br />
96%<br />
95%<br />
% of FCEs with Valid Ethnic Category<br />
Apr-09<br />
May-09<br />
Jun-09<br />
Jul-09<br />
Aug-09<br />
Sep-09<br />
Oct-09<br />
Nov-09<br />
Dec-09<br />
Jan-10<br />
Feb-10<br />
Mar-10<br />
Apr-10<br />
May-10<br />
Jun-10<br />
Jul-10<br />
Aug-10<br />
Sep-10<br />
Oct-10<br />
Nov-10<br />
Dec-10<br />
Jan-11<br />
Feb-11<br />
Mar-11<br />
Page 50
WORKFORCE OBJECTIVE<br />
PERFORMANCE REPORT<br />
Page 51
Workforce Planning and Performance Scorecard<br />
For the Period <strong>March</strong> 2010 thru' February 2011<br />
Component<br />
Establishment (WTE)<br />
Staff in Post (WTE)<br />
Vacancies (WTE)<br />
Headcount<br />
Turnover % (Exc Rotational Dctrs)<br />
Appraisals %<br />
Sickness %<br />
Sickness Cost<br />
Bradford Scores (>300)<br />
NHSP/Agency Spend<br />
NHSP/Agency less Sickness Cost<br />
Potential Retirees(HC)<br />
Training - Child Protection<br />
Training - Mandatory<br />
Training - BLS<br />
Training - Manual Handling<br />
<strong>March</strong> April May June July August September October November December January February<br />
5791.39 5795.26 5901.83 5916.34 5912.62 5902.61 5872.79 5887.97 5884.82 5876.36 5876.63 5877.08<br />
5430.27 5447.73 5446.87 5459.67 5454.35 5479.14 5489.47 5478.19 5464.5 5430.14 5402.96 5391.13<br />
451.64 499.43 493.21 465.87 452.38 406.98 418.58 404.09 420.32 446.22 473.67 485.95<br />
6416 6445 6434 6448 6447 6479 6498 6480 6460 6426 6395 6379<br />
10.44 10.17 10.16 10.19 9.96 9.68 9.49 9.72 9.44 9.58 9.61 9.43<br />
73.33 74.42 74.91 77.45 80.29 80.81 79.74 76.53 74.78 72.92 75.61 76.93<br />
5.09 4.01 4.14 4.17 4.32 3.63 4.11 4.37 4.55 5.19 4.89 3.91<br />
505139.89 402479.82 409832.68 399269 433239.46 370940.99 386867.28 432607.5 450065.38 534131.09 491539.31 350237.36<br />
930 922 907 894 849 828 813 798 740 759 742 705<br />
1110830.72 830315.62 840006.36 991000.95 1107168.13 969422.91 638846.67 724136 640906 627794.11 707724.95 617503.32<br />
605690.83 427835.8 430173.68 591731.95 673928.67 598481.92 251979.39 291528.5 190840.62 93663.02 216185.64 267265.96<br />
1203 1192 1187 1190 1196 1216 1221 1219 1225 1227 1228 1229<br />
94 94 95<br />
96 96 98<br />
98 96 98<br />
97 97 98<br />
81 85 85<br />
85 86 86<br />
85 86 86<br />
87 86 81<br />
77 84 84<br />
86 84 90<br />
88 86 87<br />
87 87 79<br />
88 89 90<br />
90 91 92<br />
91 92 90<br />
91 94 91<br />
Private & Confidential<br />
15 <strong>March</strong> 2011<br />
Page 52