The Pork Industry at a Glance - National Pork Board
The Pork Industry at a Glance - National Pork Board
The Pork Industry at a Glance - National Pork Board

You also want an ePaper? Increase the reach of your titles
YUMPU automatically turns print PDFs into web optimized ePapers that Google loves.
<strong>Pork</strong> Production<br />
Public<br />
<strong>Pork</strong><br />
Names and<br />
Environment<br />
St<strong>at</strong>s<br />
Glossary<br />
Today Health Safety Numbers<br />
Quick Facts<br />
Quick Facts<br />
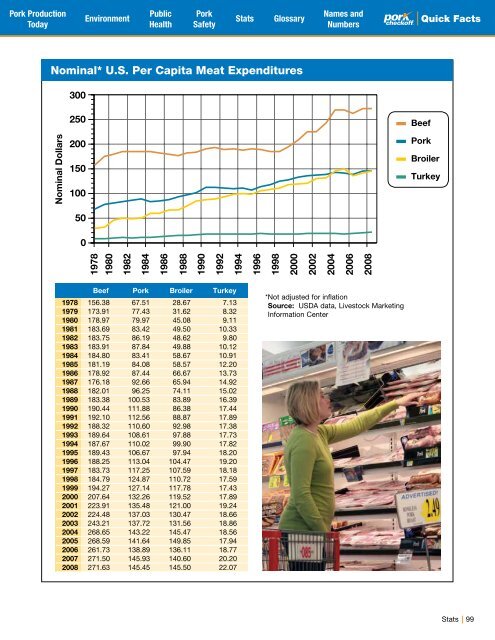
Nominal* U.S. Per Capita Me<strong>at</strong> Expenditures<br />
300<br />
250<br />
Beef<br />
Nominal Dollars<br />
200<br />
150<br />
100<br />
<strong>Pork</strong><br />
Broiler<br />
Turkey<br />
50<br />
0<br />
1978<br />
1980<br />
1982<br />
1984<br />
1986<br />
1988<br />
1990<br />
1992<br />
1994<br />
1996<br />
1998<br />
2000<br />
2002<br />
2004<br />
2006<br />
2008<br />
Beef <strong>Pork</strong> Broiler Turkey<br />
1978 156.38 67.51 28.67 7.13<br />
1979 173.91 77.43 31.62 8.32<br />
1980 178.97 79.97 45.08 9.11<br />
1981 183.69 83.42 49.50 10.33<br />
1982 183.75 86.19 48.62 9.80<br />
1983 183.91 87.84 49.88 10.12<br />
1984 184.80 83.41 58.67 10.91<br />
1985 181.19 84.08 58.57 12.20<br />
1986 178.92 87.44 66.67 13.73<br />
1987 176.18 92.66 65.94 14.92<br />
1988 182.01 96.25 74.11 15.02<br />
1989 183.38 100.53 83.89 16.39<br />
1990 190.44 111.88 86.38 17.44<br />
1991 192.10 112.56 88.87 17.89<br />
1992 188.32 110.60 92.98 17.38<br />
1993 189.64 108.61 97.88 17.73<br />
1994 187.67 110.02 99.90 17.82<br />
1995 189.43 106.67 97.94 18.20<br />
1996 188.25 113.04 104.47 19.20<br />
1997 183.73 117.25 107.59 18.18<br />
1998 184.79 124.87 110.72 17.59<br />
1999 194.27 127.14 117.78 17.43<br />
2000 207.64 132.26 119.52 17.89<br />
2001 223.91 135.48 121.00 19.24<br />
2002 224.48 137.03 130.47 18.66<br />
2003 243.21 137.72 131.56 18.86<br />
2004 268.65 143.22 145.47 18.56<br />
2005 268.59 141.64 149.85 17.94<br />
2006 261.73 138.89 136.11 18.77<br />
2007 271.50 145.93 140.60 20.20<br />
2008 271.63 145.45 145.50 22.07<br />
*Not adjusted for infl<strong>at</strong>ion<br />
Source: USDA d<strong>at</strong>a, Livestock Marketing<br />
Inform<strong>at</strong>ion Center<br />
St<strong>at</strong>s<br />
99