The Pork Industry at a Glance - National Pork Board
The Pork Industry at a Glance - National Pork Board
The Pork Industry at a Glance - National Pork Board

Create successful ePaper yourself
Turn your PDF publications into a flip-book with our unique Google optimized e-Paper software.
<strong>Pork</strong> Production<br />
Public<br />
<strong>Pork</strong><br />
Names and<br />
Environment<br />
St<strong>at</strong>s<br />
Glossary<br />
Today Health Safety Numbers<br />
Quick Facts<br />
Quick Facts<br />
<strong>Pork</strong> St<strong>at</strong>s<br />
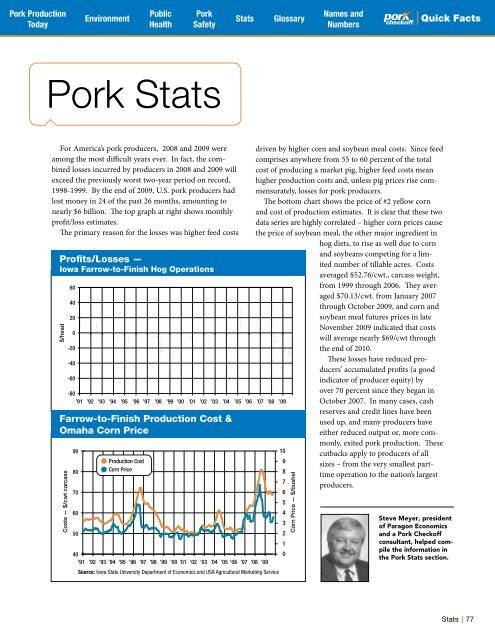
For America’s pork producers, 2008 and 2009 were<br />
among the most difficult years ever. In fact, the combined<br />
losses incurred by producers in 2008 and 2009 will<br />
exceed the previously worst two-year period on record,<br />
1998-1999. By the end of 2009, U.S. pork producers had<br />
lost money in 24 of the past 26 months, amounting to<br />
nearly $6 billion. <strong>The</strong> top graph <strong>at</strong> right shows monthly<br />
profit/loss estim<strong>at</strong>es.<br />
<strong>The</strong> primary reason for the losses was higher feed costs<br />
Profits/Losses —<br />
Iowa Farrow-to-Finish Hog Oper<strong>at</strong>ions<br />
$/head<br />
$/head<br />
Costs — $/cwt carcass<br />
Costs — $/cwt carcass<br />
60<br />
60<br />
40<br />
40<br />
20<br />
20<br />
0<br />
0<br />
-20<br />
-20<br />
-40<br />
-40<br />
-60<br />
-60<br />
-80<br />
-80<br />
’91 ’92 ’93 ’94 ’95 ’96 ’97 ’98 ’99 ’00 ’01 ’02 ’03 ’04 ’05 ’06 ’07 ’08 ’09<br />
’91 ’92 ’93 ’94 ’95 ’96 ’97 ’98 ’99 ’00 ’01 ’02 ’03 ’04 ’05 ’06 ’07 ’08 ’09<br />
Farrow-to-Finish Production Cost &<br />
Omaha Corn Price<br />
90<br />
90<br />
80<br />
80<br />
Production Cost<br />
Production Cost<br />
Corn Price<br />
Corn Price<br />
70<br />
6<br />
70<br />
6<br />
5<br />
5<br />
60<br />
4<br />
60<br />
4<br />
3<br />
3<br />
50<br />
2<br />
50<br />
2<br />
1<br />
1<br />
40<br />
0<br />
40<br />
0<br />
’91 ’92 ’93 ’94 ’95 ’96 ’97 ’98 ’99 ’00 ’01 ’02 ’03 ’04 ’05 ’06 ’07 ’08 ’09<br />
’91 ’92 ’93 ’94 ’95 ’96 ’97 ’98 ’99 ’00 ’01 ’02 ’03 ’04 ’05 ’06 ’07 ’08 ’09<br />
Source: Iowa St<strong>at</strong>e University Department of Economics and USA Agricultural Marketing Service<br />
driven by higher corn and soybean meal costs. Since feed<br />
comprises anywhere from 55 to 60 percent of the total<br />
cost of producing a market pig, higher feed costs mean<br />
higher production costs and, unless pig prices rise commensur<strong>at</strong>ely,<br />
losses for pork producers.<br />
<strong>The</strong> bottom chart shows the price of #2 yellow corn<br />
and cost of production estim<strong>at</strong>es. It is clear th<strong>at</strong> these two<br />
d<strong>at</strong>a series are highly correl<strong>at</strong>ed – higher corn prices cause<br />
the price of soybean meal, the other major ingredient in<br />
hog diets, to rise as well due to corn<br />
and soybeans competing for a limited<br />
number of tillable acres. Costs<br />
averaged $52.76/cwt., carcass weight,<br />
from 1999 through 2006. <strong>The</strong>y averaged<br />
$70.13/cwt. from January 2007<br />
through October 2009, and corn and<br />
soybean meal futures prices in l<strong>at</strong>e<br />
November 2009 indic<strong>at</strong>ed th<strong>at</strong> costs<br />
will average nearly $69/cwt through<br />
the end of 2010.<br />
<strong>The</strong>se losses have reduced producers’<br />
accumul<strong>at</strong>ed profits (a good<br />
indic<strong>at</strong>or of producer equity) by<br />
over 70 percent since they began in<br />
October 2007. In many cases, cash<br />
reserves and credit lines have been<br />
used up, and many producers have<br />
either reduced output or, more commonly,<br />
exited pork production. <strong>The</strong>se<br />
10<br />
10<br />
cutbacks apply to producers of all<br />
9<br />
9<br />
sizes – from the very smallest parttime<br />
oper<strong>at</strong>ion to the n<strong>at</strong>ion’s largest<br />
8<br />
8<br />
7<br />
7<br />
producers.<br />
Corn Price — $/bushel<br />
Corn Price — $/bushel<br />
Steve Meyer, president<br />
of Paragon Economics<br />
and a <strong>Pork</strong> Checkoff<br />
consultant, helped compile<br />
the inform<strong>at</strong>ion in<br />
the <strong>Pork</strong> St<strong>at</strong>s section.<br />
St<strong>at</strong>s<br />
77