2008 PROCEEDINGS - Public Relations Society of America
2008 PROCEEDINGS - Public Relations Society of America
2008 PROCEEDINGS - Public Relations Society of America

Create successful ePaper yourself
Turn your PDF publications into a flip-book with our unique Google optimized e-Paper software.
hypothetical crisis scenarios: unintentional accident, illegal activity, and product safety. This<br />
study has many <strong>of</strong> the typical limitations <strong>of</strong> survey research. Thirty–six surveys were<br />
returned. The completion rate for the three surveys varied from 29 to 36, depending on which<br />
<strong>of</strong> the strategies was examined.<br />
The instrument used a five-point scoring system. Categories ranged from highly unethical<br />
to highly ethical. Computational scoring ranged from five for highly unethical to one for highly<br />
ethical. Pragmatic saliencies <strong>of</strong> “effectiveness” and “likelihood to recommend” were scored the<br />
same way. Significant differences were calculated with analysis <strong>of</strong> variance within strategies and<br />
between scenarios. Scheffe’s multiple comparison procedure was used because <strong>of</strong> its relative<br />
conservative estimation <strong>of</strong> differences and ability to account for compound comparisons<br />
(Reinard, 2007). A limited number <strong>of</strong> demographic items (e.g., type <strong>of</strong> organization, years <strong>of</strong><br />
experience) were added. The hypothetical nature <strong>of</strong> the company helps control for historical or<br />
perceptual moderating factors (Coombs, 2004; Dean, 2004; Kim, et al., 2004; Pfau et al., 2004).<br />
Perceptions <strong>of</strong> Effectiveness and Ethics<br />
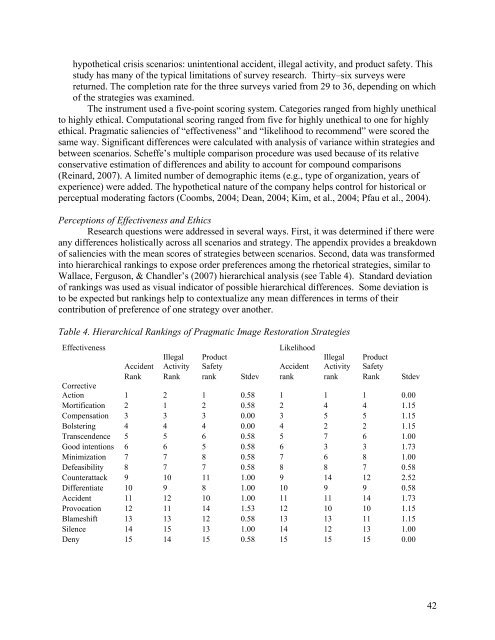
Research questions were addressed in several ways. First, it was determined if there were<br />
any differences holistically across all scenarios and strategy. The appendix provides a breakdown<br />
<strong>of</strong> saliencies with the mean scores <strong>of</strong> strategies between scenarios. Second, data was transformed<br />
into hierarchical rankings to expose order preferences among the rhetorical strategies, similar to<br />
Wallace, Ferguson, & Chandler’s (2007) hierarchical analysis (see Table 4). Standard deviation<br />
<strong>of</strong> rankings was used as visual indicator <strong>of</strong> possible hierarchical differences. Some deviation is<br />
to be expected but rankings help to contextualize any mean differences in terms <strong>of</strong> their<br />
contribution <strong>of</strong> preference <strong>of</strong> one strategy over another.<br />
Table 4. Hierarchical Rankings <strong>of</strong> Pragmatic Image Restoration Strategies<br />
Effectiveness<br />
Likelihood<br />
Accident<br />
Illegal<br />
Activity<br />
Product<br />
Safety<br />
Accident<br />
Illegal<br />
Activity<br />
Product<br />
Safety<br />
Rank Rank rank Stdev rank rank Rank Stdev<br />
Corrective<br />
Action 1 2 1 0.58 1 1 1 0.00<br />
Mortification 2 1 2 0.58 2 4 4 1.15<br />
Compensation 3 3 3 0.00 3 5 5 1.15<br />
Bolstering 4 4 4 0.00 4 2 2 1.15<br />
Transcendence 5 5 6 0.58 5 7 6 1.00<br />
Good intentions 6 6 5 0.58 6 3 3 1.73<br />
Minimization 7 7 8 0.58 7 6 8 1.00<br />
Defeasibility 8 7 7 0.58 8 8 7 0.58<br />
Counterattack 9 10 11 1.00 9 14 12 2.52<br />
Differentiate 10 9 8 1.00 10 9 9 0.58<br />
Accident 11 12 10 1.00 11 11 14 1.73<br />
Provocation 12 11 14 1.53 12 10 10 1.15<br />
Blameshift 13 13 12 0.58 13 13 11 1.15<br />
Silence 14 15 13 1.00 14 12 13 1.00<br />
Deny 15 14 15 0.58 15 15 15 0.00<br />
42