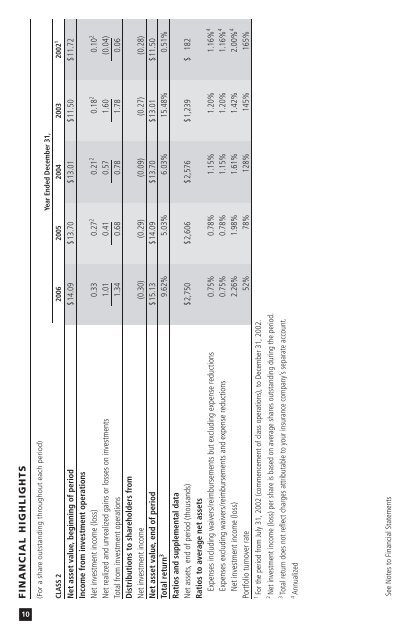
FINANCIAL HIGHLIGHTS (For a share outstanding throughout each period) CLASS 2 2006 2005 2004 2003 2002 1 Net asset value, beginning of period $14.09 $13.70 $13.01 $11.50 $11.72 Income from investment operations Net investment income (loss) 0.33 0.27 2 0.21 2 0.18 2 0.10 2 Year Ended December 31, Net realized and unrealized gains or losses on investments 1.01 0.41 0.57 1.60 (0.04) Total from investment operations 1.34 0.68 0.78 1.78 0.06 Distributions to shareholders from Net investment income (0.30) (0.29) (0.09) (0.27) (0.28) Net asset value, end of period $15.13 $14.09 $13.70 $13.01 $11.50 Total return 3 9.62% 5.03% 6.03% 15.48% 0.51% Ratios and supplemental data Net assets, end of period (thousands) $2,750 $2,606 $2,576 $1,239 $ 182 Ratios to average net assets Expenses including waivers/reimbursements but excluding expense reductions 0.75% 0.78% 1.15% 1.20% 1.16% 4 Expenses excluding waivers/reimbursements and expense reductions 0.75% 0.78% 1.15% 1.20% 1.16% 4 Net investment income (loss) 2.26% 1.98% 1.61% 1.42% 2.00% 4 Portfolio turnover rate 52% 78% 128% 145% 165% 1 For the period from July 31, 2002 (commencement of class operations), to December 31, 2002. 2 Net investment income (loss) per share is based on average shares outstanding during the period. 3 Total return does not reflect charges attributable to your insurance company’s separate account. See Notes to Financial Statements 10
SCHEDULE OF INVESTMENTS December 31, 2006 Principal Amount Value AGENCY COMMERCIAL MORTGAGE-BACKED SECURITIES 4.4% FIXED-RATE 4.4% FNMA: 3.62%, 06/01/2010........................................................................................ $ 565,000 $ 538,040 4.87%, 05/01/2013........................................................................................ 518,859 508,236 5.70%, 10/01/2008........................................................................................ 821,815 824,426 5.84%, 12/01/2008........................................................................................ 628,439 630,877 6.20%, 01/01/2011........................................................................................ 363,750 373,718 6.73%, 08/01/2009........................................................................................ 609,240 623,897 Total Agency Commercial Mortgage-Backed Securities (cost $3,613,867)......................................................................................................... 3,499,194 AGENCY MORTGAGE-BACKED COLLATERALIZED MORTGAGE OBLIGATIONS 5.2% FIXED-RATE 5.2% FHLMC: Ser. 2702, Class AD, 4.50%, 08/15/2032......................................................... 260,000 245,456 Ser. 2709, Class PE, 5.00%, 12/15/2022 ......................................................... 300,000 289,499 Ser. 2718, Class MR, 4.00%, 08/15/2013........................................................ 175,920 173,646 Ser. 2894, Class QC, 5.50%, 05/15/2030......................................................... 395,000 392,234 Ser. 3014, Class NA, 4.50%, 11/15/2025 ........................................................ 236,584 233,712 Ser. 3072, Class NK, 5.00%, 05/15/2031......................................................... 204,509 201,551 Ser. 3082, Class PJ, 5.00%, 09/15/2034 .......................................................... 335,000 318,947 Ser. 3115, Class LA, 5.00%, 06/15/2031 ......................................................... 236,049 232,607 Ser. 3138, Class PC, 5.50%, 06/15/2032 ......................................................... 290,000 287,950 Ser. 3187, Class JA, 5.00%, 02/15/2032.......................................................... 259,546 254,734 FNMA: Ser. 2001-71, Class QE, 6.00%, 12/25/2016.................................................... 302,325 306,346 Ser. 2004-26, Class PA, 4.50%, 09/25/2025.................................................... 318,377 314,133 Ser. 2005-22, Class DA, 5.50%, 12/25/2034 ................................................... 351,196 351,403 Ser. 2006-63, Class QE, 5.50%, 11/25/2032.................................................... 270,000 267,487 Ser. 2006-67, Class PC, 5.50%, 03/25/2033.................................................... 265,000 263,027 Total Agency Mortgage-Backed Collateralized Mortgage Obligations (cost $4,134,936)..................................................................................... 4,132,732 AGENCY MORTGAGE-BACKED PASS THROUGH SECURITIES 6.0% FIXED-RATE 3.9% FHLMC, 5.00%, 04/01/2021 ................................................................................. 310,399 305,070 FNMA: 4.50%, 04/01/2019........................................................................................ 292,406 282,515 5.00%, 03/01/2036........................................................................................ 283,163 279,085 5.50%, 02/01/2035 - 09/01/2035 .................................................................. 508,512 503,168 7.50%, 12/01/2030........................................................................................ 83,237 86,921 FNMA 15 year, 5.00%, TBA #................................................................................ 565,000 555,465 FNMA 30 year: 5.50%, TBA # ................................................................................................. 425,000 420,086 6.00%, TBA # ................................................................................................. 610,000 614,194 3,046,504 See Notes to Financial Statements 11