

Evergreen - Prudential
Evergreen - Prudential
Evergreen - Prudential

You also want an ePaper? Increase the reach of your titles
YUMPU automatically turns print PDFs into web optimized ePapers that Google loves.
FUND AT A GLANCE<br />
as of December 31, 2006<br />
MANAGEMENT<br />
TEAM<br />
Investment Advisor:<br />
• <strong>Evergreen</strong><br />
Investment<br />
Management<br />
Company, LLC<br />
Sub-Advisor:<br />
• Tattersall Advisory<br />
Group, Inc.<br />
Portfolio Managers:<br />
• Walter T.<br />
McCormick, CFA<br />
• Robert A.<br />
Calhoun, CFA<br />
• Parham M.<br />
Behrooz, CFA<br />
• Mehmet<br />
Camurdan, CFA<br />
• Eric R. Harper, CFA<br />
• Todd C. Kuimjian,<br />
CFA<br />
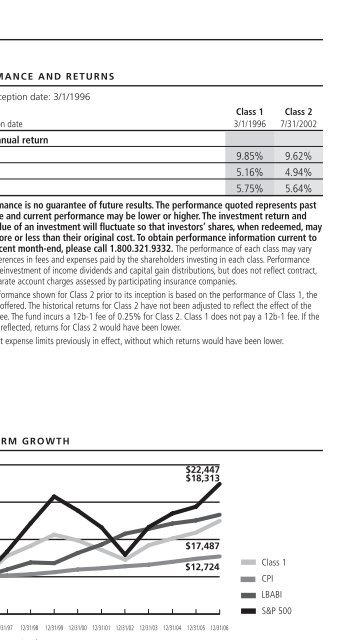
PERFORMANCE AND RETURNS<br />
Portfolio inception date: 3/1/1996<br />
Class 1 Class 2<br />
Class inception date 3/1/1996 7/31/2002<br />
Average annual return<br />
1-year 9.85% 9.62%<br />
5-year 5.16% 4.94%<br />
10-year 5.75% 5.64%<br />
Past performance is no guarantee of future results. The performance quoted represents past<br />
performance and current performance may be lower or higher. The investment return and<br />
principal value of an investment will fluctuate so that investors’ shares, when redeemed, may<br />
be worth more or less than their original cost. To obtain performance information current to<br />
the most recent month-end, please call 1.800.321.9332. The performance of each class may vary<br />
based on differences in fees and expenses paid by the shareholders investing in each class. Performance<br />
includes the reinvestment of income dividends and capital gain distributions, but does not reflect contract,<br />
policy, or separate account charges assessed by participating insurance companies.<br />
Historical performance shown for Class 2 prior to its inception is based on the performance of Class 1, the<br />
original class offered. The historical returns for Class 2 have not been adjusted to reflect the effect of the<br />
class’ 12b-1 fee. The fund incurs a 12b-1 fee of 0.25% for Class 2. Class 1 does not pay a 12b-1 fee. If the<br />
fee had been reflected, returns for Class 2 would have been lower.<br />
Returns reflect expense limits previously in effect, without which returns would have been lower.<br />
LONG-TERM GROWTH<br />
$25,000<br />
$22,447<br />
$18,313<br />
$20,000<br />
$15,000<br />
$10,000<br />
$5,000<br />
$17,487<br />
$12,724<br />
12/31/96 12/31/97 12/31/98 12/31/99 12/31/00 12/31/01 12/31/02 12/31/03 12/31/04 12/31/05 12/31/06<br />
Class 1<br />
LBABI<br />
S&P 500<br />
Comparison of a $10,000 investment in the <strong>Evergreen</strong> VA Balanced Fund Class<br />
1 shares versus a similar investment in the Lehman Brothers Aggregate Bond<br />
Index (LBABI), the S&P 500 Index (S&P 500) and the Consumer Price Index<br />
(CPI).<br />
CPI<br />
6<br />
The LBABI and the S&P 500 are unmanaged market indexes and do not<br />
include transaction costs associated with buying and selling securities, any<br />
mutual fund fees or expenses or any taxes. The CPI is a commonly used<br />
measure of inflation and does not represent an investment return. It is not<br />
possible to invest directly in an index.


