

Evergreen - Prudential
Evergreen - Prudential
Evergreen - Prudential

You also want an ePaper? Increase the reach of your titles
YUMPU automatically turns print PDFs into web optimized ePapers that Google loves.
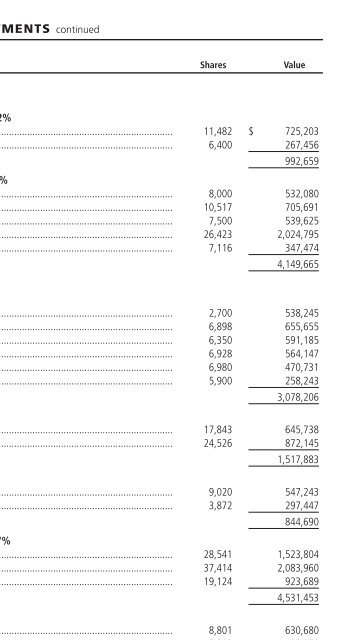
SCHEDULE OF INVESTMENTS continued<br />
December 31, 2006<br />
Shares<br />
Value<br />
COMMON STOCKS continued<br />
ENERGY 6.5%<br />
Energy Equipment & Services 1.2%<br />
Schlumberger, Ltd. ................................................................................................ 11,482 $ 725,203<br />
Weatherford International, Ltd. *........................................................................... 6,400 267,456<br />
992,659<br />
Oil, Gas & Consumable Fuels 5.3%<br />
Apache Corp. ....................................................................................................... 8,000 532,080<br />
BP plc, ADR........................................................................................................... 10,517 705,691<br />
ConocoPhillips ...................................................................................................... 7,500 539,625<br />
Exxon Mobil Corp. ................................................................................................ 26,423 2,024,795<br />
Occidental Petroleum Corp. .................................................................................. 7,116 347,474<br />
4,149,665<br />
FINANCIALS 14.6%<br />
Capital Markets 3.9%<br />
Goldman Sachs Group, Inc. ................................................................................... 2,700 538,245<br />
Legg Mason, Inc. .................................................................................................. 6,898 655,655<br />
Merrill Lynch & Co., Inc. ........................................................................................ 6,350 591,185<br />
Morgan Stanley..................................................................................................... 6,928 564,147<br />
State Street Corp. ................................................................................................. 6,980 470,731<br />
T. Rowe Price Group, Inc. ...................................................................................... 5,900 258,243<br />
3,078,206<br />
Commercial Banks 1.9%<br />
U.S. Bancorp ......................................................................................................... 17,843 645,738<br />
Wells Fargo & Co. ................................................................................................. 24,526 872,145<br />
1,517,883<br />
Consumer Finance 1.1%<br />
American Express Co. ........................................................................................... 9,020 547,243<br />
Capital One Financial Corp. .................................................................................. 3,872 297,447<br />
844,690<br />
Diversified Financial Services 5.7%<br />
Bank of America Corp. .......................................................................................... 28,541 1,523,804<br />
Citigroup, Inc. ....................................................................................................... 37,414 2,083,960<br />
JPMorgan Chase & Co. ......................................................................................... 19,124 923,689<br />
4,531,453<br />
Insurance 2.0%<br />
American International Group, Inc. ........................................................................ 8,801 630,680<br />
Hartford Financial Services Group, Inc. .................................................................. 5,208 485,958<br />
<strong>Prudential</strong> Financial, Inc. ....................................................................................... 5,037 432,477<br />
1,549,115<br />
See Notes to Financial Statements<br />
16


