

Evergreen - Prudential
Evergreen - Prudential
Evergreen - Prudential

You also want an ePaper? Increase the reach of your titles
YUMPU automatically turns print PDFs into web optimized ePapers that Google loves.
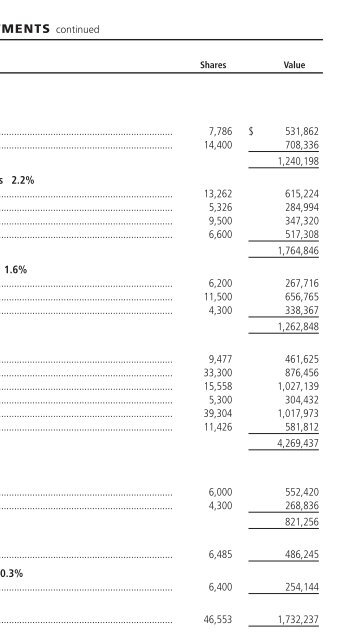
SCHEDULE OF INVESTMENTS continued<br />
December 31, 2006<br />
Shares<br />
Value<br />
COMMON STOCKS continued<br />
HEALTH CARE 10.8%<br />
Biotechnology 1.6%<br />
Amgen, Inc. *........................................................................................................ 7,786 $ 531,862<br />
Biogen Idec, Inc. *................................................................................................. 14,400 708,336<br />
1,240,198<br />
Health Care Equipment & Supplies 2.2%<br />
Baxter International, Inc. ...................................................................................... 13,262 615,224<br />
Medtronic, Inc. ..................................................................................................... 5,326 284,994<br />
St. Jude Medical, Inc. *.......................................................................................... 9,500 347,320<br />
Zimmer Holdings, Inc. * ......................................................................................... 6,600 517,308<br />
1,764,846<br />
Health Care Providers & Services 1.6%<br />
Aetna, Inc. ........................................................................................................... 6,200 267,716<br />
Caremark Rx, Inc. ................................................................................................. 11,500 656,765<br />
WellPoint, Inc. * .................................................................................................... 4,300 338,367<br />
1,262,848<br />
Pharmaceuticals 5.4%<br />
Abbott Laboratories .............................................................................................. 9,477 461,625<br />
Bristol-Myers Co. .................................................................................................. 33,300 876,456<br />
Johnson & Johnson ............................................................................................... 15,558 1,027,139<br />
Novartis AG, ADR .................................................................................................. 5,300 304,432<br />
Pfizer, Inc. ............................................................................................................ 39,304 1,017,973<br />
Wyeth................................................................................................................... 11,426 581,812<br />
4,269,437<br />
INDUSTRIALS 5.5%<br />
Aerospace & Defense 1.1%<br />
Lockheed Martin Corp. ......................................................................................... 6,000 552,420<br />
United Technologies Corp. .................................................................................... 4,300 268,836<br />
821,256<br />
Air Freight & Logistics 0.6%<br />
United Parcel Service, Inc., Class B ......................................................................... 6,485 486,245<br />
Commercial Services & Supplies 0.3%<br />
Cintas Corp. ......................................................................................................... 6,400 254,144<br />
Industrial Conglomerates 2.2%<br />
General Electric Co. .............................................................................................. 46,553 1,732,237<br />
Machinery 1.3%<br />
Deere & Co. ......................................................................................................... 3,271 310,974<br />
Pall Corp. ............................................................................................................. 21,300 735,915<br />
1,046,889<br />
See Notes to Financial Statements<br />
17


