School Community Integration Pilot Project - Department of Education
School Community Integration Pilot Project - Department of Education
School Community Integration Pilot Project - Department of Education
You also want an ePaper? Increase the reach of your titles
YUMPU automatically turns print PDFs into web optimized ePapers that Google loves.
A comparative analysis <strong>of</strong> education expenditure in Eastern Cape schools – November 2004<br />
Eastern Cape is close. It is noticeable that the relatively wealthier provinces still<br />
generally have a higher per capita expenditure on education.<br />
Non-personnel non-capital (NPNC) expenditure per learner<br />
Non-personnel non-capital (NPNC) expenditure in public schools is a crucially<br />
important area for educational performance, as the <strong>Department</strong> <strong>of</strong> <strong>Education</strong>’s 2003<br />
Review noted. NPNC recurrent funding is used to purchase essential learner<br />
materials and equipment for the classroom and to run school services. NPNC per<br />
capita in public schools represents the funding available to each learner for a<br />
‘package’ <strong>of</strong> learner materials and support. It is vital that provinces prioritise this area<br />
for funding. National Treasury has drawn attention to the importance <strong>of</strong> nonpersonnel<br />
non-capital (NPNC) expenditure for educational outcomes. The 2003<br />
Inter-Governmental Fiscal Review (IGFR) notes that ‘the provinces with low nonpersonnel<br />
non-capital expenditure per learner in public schools also have low senior<br />
certificate pass rates’ 11 . The table below compares NPNC per capita across the<br />
provinces in recent years.<br />
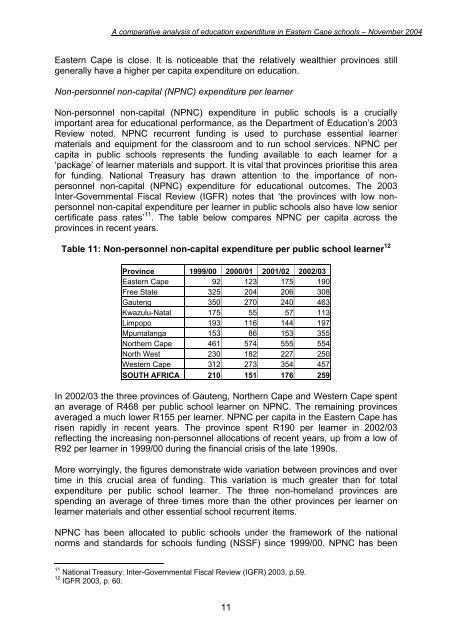
Table 11: Non-personnel non-capital expenditure per public school learner 12<br />
Province 1999/00 2000/01 2001/02 2002/03<br />
Eastern Cape 92 123 175 190<br />
Free State 325 204 206 308<br />
Gauteng 350 270 240 463<br />
Kwazulu-Natal 175 55 57 113<br />
Limpopo 193 116 144 197<br />
Mpumalanga 153 86 153 355<br />
Northern Cape 461 574 555 554<br />
North West 230 182 227 250<br />
Western Cape 312 273 354 457<br />
SOUTH AFRICA 210 151 176 259<br />
In 2002/03 the three provinces <strong>of</strong> Gauteng, Northern Cape and Western Cape spent<br />
an average <strong>of</strong> R468 per public school learner on NPNC. The remaining provinces<br />
averaged a much lower R155 per learner. NPNC per capita in the Eastern Cape has<br />
risen rapidly in recent years. The province spent R190 per learner in 2002/03<br />
reflecting the increasing non-personnel allocations <strong>of</strong> recent years, up from a low <strong>of</strong><br />
R92 per learner in 1999/00 during the financial crisis <strong>of</strong> the late 1990s.<br />
More worryingly, the figures demonstrate wide variation between provinces and over<br />
time in this crucial area <strong>of</strong> funding. This variation is much greater than for total<br />
expenditure per public school learner. The three non-homeland provinces are<br />
spending an average <strong>of</strong> three times more than the other provinces per learner on<br />
learner materials and other essential school recurrent items.<br />
NPNC has been allocated to public schools under the framework <strong>of</strong> the national<br />
norms and standards for schools funding (NSSF) since 1999/00. NPNC has been<br />
11 National Treasury: Inter-Governmental Fiscal Review (IGFR) 2003, p.59.<br />
12 IGFR 2003, p. 60.<br />
11


