

School Community Integration Pilot Project - Department of Education
School Community Integration Pilot Project - Department of Education
School Community Integration Pilot Project - Department of Education

You also want an ePaper? Increase the reach of your titles
YUMPU automatically turns print PDFs into web optimized ePapers that Google loves.
A comparative analysis <strong>of</strong> education expenditure in Eastern Cape schools – November 2004<br />
6.3. Scenario 3: A New Establishment Of 61,431<br />
This scenario simulates the impact <strong>of</strong> a three year phased introduction <strong>of</strong> the<br />
proposed 2005 establishment <strong>of</strong> 61,431. The average LER would rise from 32.2 to<br />
35.0 over the three year period. There would therefore be a similar, although greater<br />
impact, to the structural changes proposed in scenario 1. The principal difference<br />
between the two scenarios is structural. Without changes in the structure <strong>of</strong> the<br />
school system an average LER <strong>of</strong> 35:1 would lead to a significantly lower LER in<br />
small schools and a correspondingly higher LER, especially in primary schools. This<br />
is due to the distribution inherent in the post provisioning model towards small<br />
schools and secondary schools which have a greater number <strong>of</strong> learning areas.<br />
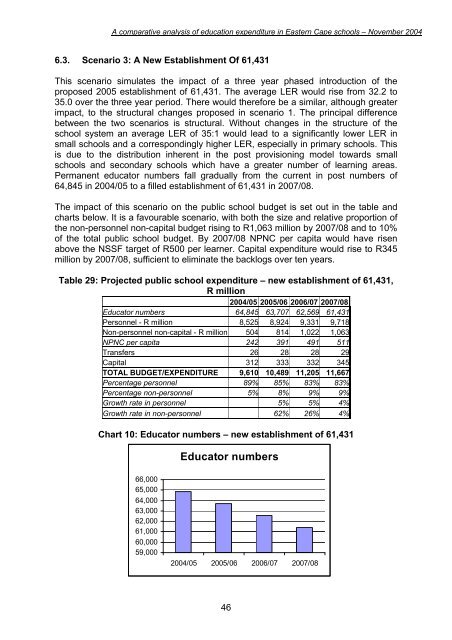
Permanent educator numbers fall gradually from the current in post numbers <strong>of</strong><br />
64,845 in 2004/05 to a filled establishment <strong>of</strong> 61,431 in 2007/08.<br />
The impact <strong>of</strong> this scenario on the public school budget is set out in the table and<br />
charts below. It is a favourable scenario, with both the size and relative proportion <strong>of</strong><br />
the non-personnel non-capital budget rising to R1,063 million by 2007/08 and to 10%<br />
<strong>of</strong> the total public school budget. By 2007/08 NPNC per capita would have risen<br />
above the NSSF target <strong>of</strong> R500 per learner. Capital expenditure would rise to R345<br />
million by 2007/08, sufficient to eliminate the backlogs over ten years.<br />
Table 29: <strong>Project</strong>ed public school expenditure – new establishment <strong>of</strong> 61,431,<br />
R million<br />
2004/05 2005/06 2006/07 2007/08<br />
Educator numbers 64,845 63,707 62,569 61,431<br />
Personnel - R million 8,525 8,924 9,331 9,718<br />
Non-personnel non-capital - R million 504 814 1,022 1,063<br />
NPNC per capita 242 391 491 511<br />
Transfers 26 28 28 29<br />
Capital 312 333 332 345<br />
TOTAL BUDGET/EXPENDITURE 9,610 10,489 11,205 11,667<br />
Percentage personnel 89% 85% 83% 83%<br />
Percentage non-personnel 5% 8% 9% 9%<br />
Growth rate in personnel 5% 5% 4%<br />
Growth rate in non-personnel 62% 26% 4%<br />
Chart 10: Educator numbers – new establishment <strong>of</strong> 61,431<br />
Educator numbers<br />
66,000<br />
65,000<br />
64,000<br />
63,000<br />
62,000<br />
61,000<br />
60,000<br />
59,000<br />
2004/05 2005/06 2006/07 2007/08<br />
46


