

School Community Integration Pilot Project - Department of Education
School Community Integration Pilot Project - Department of Education
School Community Integration Pilot Project - Department of Education

You also want an ePaper? Increase the reach of your titles
YUMPU automatically turns print PDFs into web optimized ePapers that Google loves.
A comparative analysis <strong>of</strong> education expenditure in Eastern Cape schools – November 2004<br />
6.2. Scenario 2: The Current Establishment Of 67,074<br />
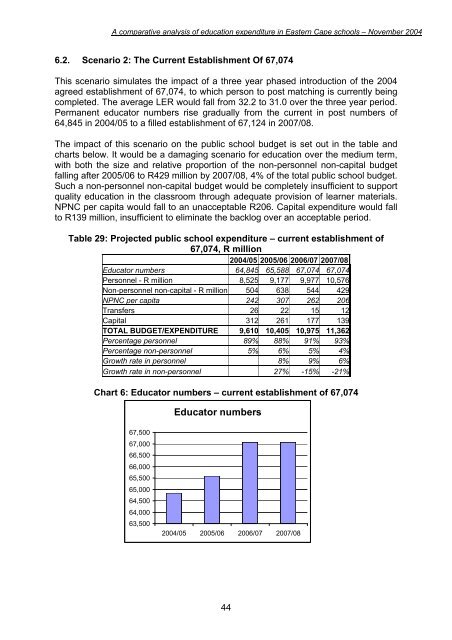
This scenario simulates the impact <strong>of</strong> a three year phased introduction <strong>of</strong> the 2004<br />
agreed establishment <strong>of</strong> 67,074, to which person to post matching is currently being<br />
completed. The average LER would fall from 32.2 to 31.0 over the three year period.<br />
Permanent educator numbers rise gradually from the current in post numbers <strong>of</strong><br />
64,845 in 2004/05 to a filled establishment <strong>of</strong> 67,124 in 2007/08.<br />
The impact <strong>of</strong> this scenario on the public school budget is set out in the table and<br />
charts below. It would be a damaging scenario for education over the medium term,<br />
with both the size and relative proportion <strong>of</strong> the non-personnel non-capital budget<br />
falling after 2005/06 to R429 million by 2007/08, 4% <strong>of</strong> the total public school budget.<br />
Such a non-personnel non-capital budget would be completely insufficient to support<br />
quality education in the classroom through adequate provision <strong>of</strong> learner materials.<br />
NPNC per capita would fall to an unacceptable R206. Capital expenditure would fall<br />
to R139 million, insufficient to eliminate the backlog over an acceptable period.<br />
Table 29: <strong>Project</strong>ed public school expenditure – current establishment <strong>of</strong><br />
67,074, R million<br />
2004/05 2005/06 2006/07 2007/08<br />
Educator numbers 64,845 65,588 67,074 67,074<br />
Personnel - R million 8,525 9,177 9,977 10,576<br />
Non-personnel non-capital - R million 504 638 544 429<br />
NPNC per capita 242 307 262 206<br />
Transfers 26 22 15 12<br />
Capital 312 261 177 139<br />
TOTAL BUDGET/EXPENDITURE 9,610 10,405 10,975 11,362<br />
Percentage personnel 89% 88% 91% 93%<br />
Percentage non-personnel 5% 6% 5% 4%<br />
Growth rate in personnel 8% 9% 6%<br />
Growth rate in non-personnel 27% -15% -21%<br />
Chart 6: Educator numbers – current establishment <strong>of</strong> 67,074<br />
Educator numbers<br />
67,500<br />
67,000<br />
66,500<br />
66,000<br />
65,500<br />
65,000<br />
64,500<br />
64,000<br />
63,500<br />
2004/05 2005/06 2006/07 2007/08<br />
44


