

School Community Integration Pilot Project - Department of Education
School Community Integration Pilot Project - Department of Education
School Community Integration Pilot Project - Department of Education

Create successful ePaper yourself
Turn your PDF publications into a flip-book with our unique Google optimized e-Paper software.
A comparative analysis <strong>of</strong> education expenditure in Eastern Cape schools – November 2004<br />
6.1. Scenario 1: No Combined <strong>School</strong>s or Small Secondary <strong>School</strong>s<br />
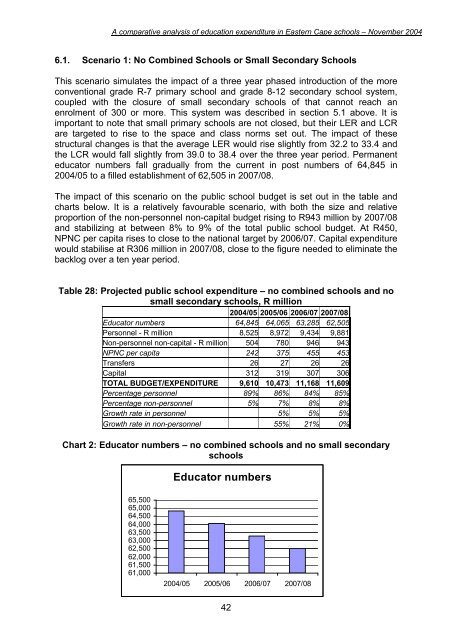
This scenario simulates the impact <strong>of</strong> a three year phased introduction <strong>of</strong> the more<br />
conventional grade R-7 primary school and grade 8-12 secondary school system,<br />
coupled with the closure <strong>of</strong> small secondary schools <strong>of</strong> that cannot reach an<br />
enrolment <strong>of</strong> 300 or more. This system was described in section 5.1 above. It is<br />
important to note that small primary schools are not closed, but their LER and LCR<br />
are targeted to rise to the space and class norms set out. The impact <strong>of</strong> these<br />
structural changes is that the average LER would rise slightly from 32.2 to 33.4 and<br />
the LCR would fall slightly from 39.0 to 38.4 over the three year period. Permanent<br />
educator numbers fall gradually from the current in post numbers <strong>of</strong> 64,845 in<br />
2004/05 to a filled establishment <strong>of</strong> 62,505 in 2007/08.<br />
The impact <strong>of</strong> this scenario on the public school budget is set out in the table and<br />
charts below. It is a relatively favourable scenario, with both the size and relative<br />
proportion <strong>of</strong> the non-personnel non-capital budget rising to R943 million by 2007/08<br />
and stabilizing at between 8% to 9% <strong>of</strong> the total public school budget. At R450,<br />
NPNC per capita rises to close to the national target by 2006/07. Capital expenditure<br />
would stabilise at R306 million in 2007/08, close to the figure needed to eliminate the<br />
backlog over a ten year period.<br />
Table 28: <strong>Project</strong>ed public school expenditure – no combined schools and no<br />
small secondary schools, R million<br />
2004/05 2005/06 2006/07 2007/08<br />
Educator numbers 64,845 64,065 63,285 62,505<br />
Personnel - R million 8,525 8,972 9,434 9,881<br />
Non-personnel non-capital - R million 504 780 946 943<br />
NPNC per capita 242 375 455 453<br />
Transfers 26 27 26 26<br />
Capital 312 319 307 306<br />
TOTAL BUDGET/EXPENDITURE 9,610 10,473 11,168 11,609<br />
Percentage personnel 89% 86% 84% 85%<br />
Percentage non-personnel 5% 7% 8% 8%<br />
Growth rate in personnel 5% 5% 5%<br />
Growth rate in non-personnel 55% 21% 0%<br />
Chart 2: Educator numbers – no combined schools and no small secondary<br />
schools<br />
Educator numbers<br />
65,500<br />
65,000<br />
64,500<br />
64,000<br />
63,500<br />
63,000<br />
62,500<br />
62,000<br />
61,500<br />
61,000<br />
2004/05 2005/06 2006/07 2007/08<br />
42


