Application of New Pedestrian Level of Service Measures - sacog
Application of New Pedestrian Level of Service Measures - sacog
Application of New Pedestrian Level of Service Measures - sacog

Create successful ePaper yourself
Turn your PDF publications into a flip-book with our unique Google optimized e-Paper software.
<strong>Application</strong> <strong>of</strong> <strong>New</strong> <strong>Pedestrian</strong> <strong>Level</strong> <strong>of</strong> <strong>Service</strong> <strong>Measures</strong><br />
SACOG<br />
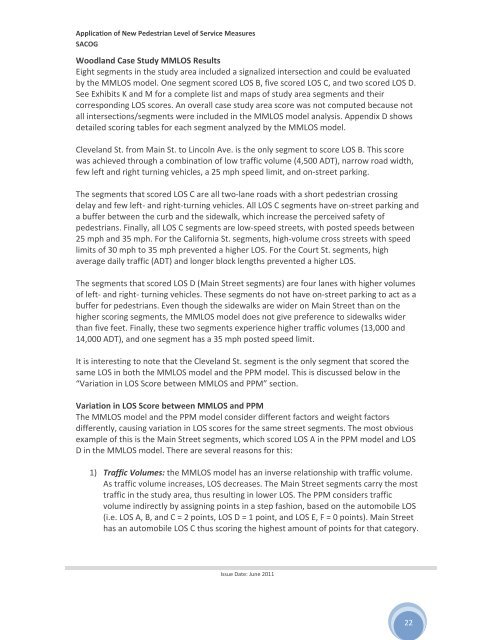
Woodland Case Study MMLOS Results<br />
Eight segments in the study area included a signalized intersection and could be evaluated<br />
by the MMLOS model. One segment scored LOS B, five scored LOS C, and two scored LOS D.<br />
See Exhibits K and M for a complete list and maps <strong>of</strong> study area segments and their<br />
corresponding LOS scores. An overall case study area score was not computed because not<br />
all intersections/segments were included in the MMLOS model analysis. Appendix D shows<br />
detailed scoring tables for each segment analyzed by the MMLOS model.<br />
Cleveland St. from Main St. to Lincoln Ave. is the only segment to score LOS B. This score<br />
was achieved through a combination <strong>of</strong> low traffic volume (4,500 ADT), narrow road width,<br />
few left and right turning vehicles, a 25 mph speed limit, and on‐street parking.<br />
The segments that scored LOS C are all two‐lane roads with a short pedestrian crossing<br />
delay and few left‐ and right‐turning vehicles. All LOS C segments have on‐street parking and<br />
a buffer between the curb and the sidewalk, which increase the perceived safety <strong>of</strong><br />
pedestrians. Finally, all LOS C segments are low‐speed streets, with posted speeds between<br />
25 mph and 35 mph. For the California St. segments, high‐volume cross streets with speed<br />
limits <strong>of</strong> 30 mph to 35 mph prevented a higher LOS. For the Court St. segments, high<br />
average daily traffic (ADT) and longer block lengths prevented a higher LOS.<br />
The segments that scored LOS D (Main Street segments) are four lanes with higher volumes<br />
<strong>of</strong> left‐ and right‐ turning vehicles. These segments do not have on‐street parking to act as a<br />
buffer for pedestrians. Even though the sidewalks are wider on Main Street than on the<br />
higher scoring segments, the MMLOS model does not give preference to sidewalks wider<br />
than five feet. Finally, these two segments experience higher traffic volumes (13,000 and<br />
14,000 ADT), and one segment has a 35 mph posted speed limit.<br />
It is interesting to note that the Cleveland St. segment is the only segment that scored the<br />
same LOS in both the MMLOS model and the PPM model. This is discussed below in the<br />
“Variation in LOS Score between MMLOS and PPM” section.<br />
Variation in LOS Score between MMLOS and PPM<br />
The MMLOS model and the PPM model consider different factors and weight factors<br />
differently, causing variation in LOS scores for the same street segments. The most obvious<br />
example <strong>of</strong> this is the Main Street segments, which scored LOS A in the PPM model and LOS<br />
D in the MMLOS model. There are several reasons for this:<br />
1) Traffic Volumes: the MMLOS model has an inverse relationship with traffic volume.<br />
As traffic volume increases, LOS decreases. The Main Street segments carry the most<br />
traffic in the study area, thus resulting in lower LOS. The PPM considers traffic<br />
volume indirectly by assigning points in a step fashion, based on the automobile LOS<br />
(i.e. LOS A, B, and C = 2 points, LOS D = 1 point, and LOS E, F = 0 points). Main Street<br />
has an automobile LOS C thus scoring the highest amount <strong>of</strong> points for that category.<br />
Issue Date: June 2011<br />
22