Malaysia - SETatWork - Sustainable Energy Technology at Work
Malaysia - SETatWork - Sustainable Energy Technology at Work
Malaysia - SETatWork - Sustainable Energy Technology at Work

Create successful ePaper yourself
Turn your PDF publications into a flip-book with our unique Google optimized e-Paper software.
1.3 <strong>Malaysia</strong> <strong>Energy</strong> Consumption<br />
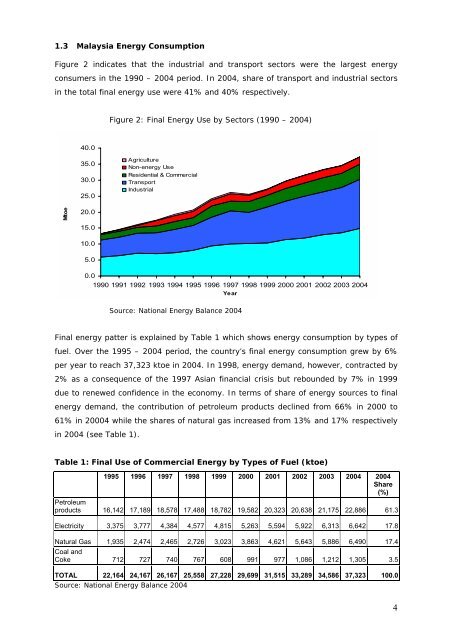
Figure 2 indic<strong>at</strong>es th<strong>at</strong> the industrial and transport sectors were the largest energy<br />
consumers in the 1990 – 2004 period. In 2004, share of transport and industrial sectors<br />
in the total final energy use were 41% and 40% respectively.<br />
Figure 2: Final <strong>Energy</strong> Use by Sectors (1990 – 2004)<br />
40.0<br />
35.0<br />
30.0<br />
25.0<br />
Agriculture<br />
Non-energy Use<br />
Residential & Commercial<br />
Transport<br />
Industrial<br />
Mtoe<br />
20.0<br />
15.0<br />
10.0<br />
5.0<br />
0.0<br />
1990 1991 1992 1993 1994 1995 1996 1997 1998 1999 2000 2001 2002 2003 2004<br />
Year<br />
Source: N<strong>at</strong>ional <strong>Energy</strong> Balance 2004<br />
Final energy p<strong>at</strong>ter is explained by Table 1 which shows energy consumption by types of<br />
fuel. Over the 1995 – 2004 period, the country’s final energy consumption grew by 6%<br />
per year to reach 37,323 ktoe in 2004. In 1998, energy demand, however, contracted by<br />
2% as a consequence of the 1997 Asian financial crisis but rebounded by 7% in 1999<br />
due to renewed confidence in the economy. In terms of share of energy sources to final<br />
energy demand, the contribution of petroleum products declined from 66% in 2000 to<br />
61% in 20004 while the shares of n<strong>at</strong>ural gas increased from 13% and 17% respectively<br />
in 2004 (see Table 1).<br />
Table 1: Final Use of Commercial <strong>Energy</strong> by Types of Fuel (ktoe)<br />
1995 1996 1997 1998 1999 2000 2001 2002 2003 2004 2004<br />
Share<br />
(%)<br />
Petroleum<br />
products 16,142 17,189 18,578 17,488 18,782 19,582 20,323 20,638 21,175 22,886 61.3<br />
Electricity 3,375 3,777 4,384 4,577 4,815 5,263 5,594 5,922 6,313 6,642 17.8<br />
N<strong>at</strong>ural Gas 1,935 2,474 2,465 2,726 3,023 3,863 4,621 5,643 5,886 6,490 17.4<br />
Coal and<br />
Coke 712 727 740 767 608 991 977 1,086 1,212 1,305 3.5<br />
TOTAL 22,164 24,167 26,167 25,558 27,228 29,699 31,515 33,289 34,586 37,323 100.0<br />
Source: N<strong>at</strong>ional <strong>Energy</strong> Balance 2004<br />
4