Annual Report 2010 - S&T
Annual Report 2010 - S&T
Annual Report 2010 - S&T

You also want an ePaper? Increase the reach of your titles
YUMPU automatically turns print PDFs into web optimized ePapers that Google loves.
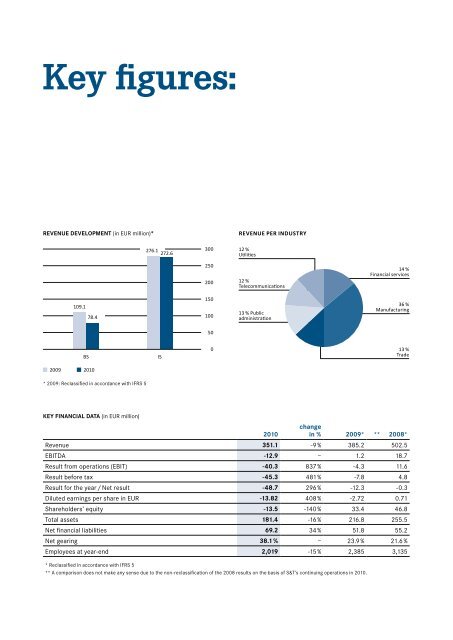
Key figures:<br />
Revenue development (in EUR million)*<br />
276.1 272.6<br />
300<br />
Revenue peR industRy<br />
12 %<br />
Utilities<br />
250<br />
200<br />
12 %<br />
Telecommunications<br />
14 %<br />
Financial services<br />
109.1<br />
78.4<br />
150<br />
100<br />
13 % Public<br />
administration<br />
36 %<br />
Manufacturing<br />
50<br />
BS<br />
IS<br />
0<br />
13 %<br />
Trade<br />
2009 <strong>2010</strong><br />
* 2009: Reclassified in accordance with IFRS 5<br />
Key financial data (in EUR million)<br />
<strong>2010</strong><br />
change<br />
in % 2009* ** 2008*<br />
Revenue 351.1 -9% 385.2 502.5<br />
EBITDA -12.9 – 1.2 18.7<br />
Result from operations (EBIT) -40.3 837 % -4.3 11.6<br />
Result before tax -45.3 481 % -7.8 4.8<br />
Result for the year / Net result -48.7 296 % -12.3 -0.3<br />
Diluted earnings per share in EUR -13.82 408 % -2.72 0.71<br />
Shareholders’ equity -13.5 -140 % 33.4 46.8<br />
Total assets 181.4 -16 % 216.8 255.5<br />
Net financial liabilities 69.2 34 % 51.8 55.2<br />
Net gearing 38.1 % – 23.9 % 21.6 %<br />
Employees at year-end 2,019 -15 % 2,385 3,135<br />
* Reclassified in accordance with IFRS 5<br />
** A comparison does not make any sense due to the non-reclassification of the 2008 results on the basis of S&T’s continuing operations in <strong>2010</strong>.