Annual Report 2010 - S&T
Annual Report 2010 - S&T
Annual Report 2010 - S&T

You also want an ePaper? Increase the reach of your titles
YUMPU automatically turns print PDFs into web optimized ePapers that Google loves.
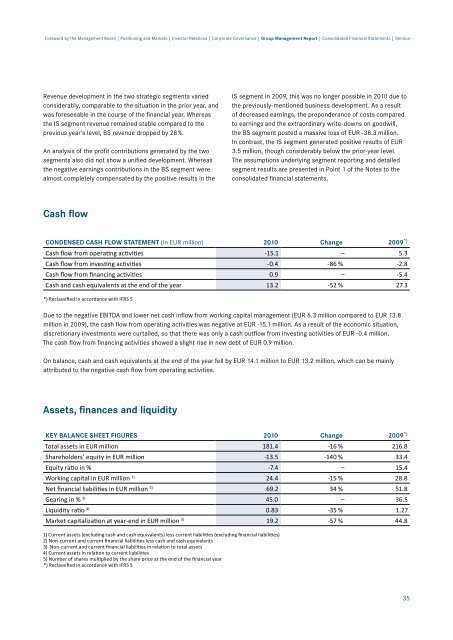
Foreword by the Management Board | Positioning and Markets | Investor Relations | Corporate Governance | Group Management <strong>Report</strong> | Consolidated Financial Statements | Service<br />
Revenue development in the two strategic segments varied<br />
considerably, comparable to the situation in the prior year, and<br />
was foreseeable in the course of the financial year. Whereas<br />
the IS segment revenue remained stable compared to the<br />
previous year’s level, BS revenue dropped by 28 %.<br />
An analysis of the profit contributions generated by the two<br />
segments also did not show a unified development. Whereas<br />
the negative earnings contributions in the BS segment were<br />
almost completely compensated by the positive results in the<br />
IS segment in 2009, this was no longer possible in <strong>2010</strong> due to<br />
the previously-mentioned business development. As a result<br />
of decreased earnings, the preponderance of costs compared<br />
to earnings and the extraordinary write-downs on goodwill,<br />
the BS segment posted a massive loss of EUR -38.3 million.<br />
In contrast, the IS segment generated positive results of EUR<br />
3.5 million, though considerably below the prior-year level.<br />
The assumptions underlying segment reporting and detailed<br />
segment results are presented in Point 1 of the Notes to the<br />
consolidated financial statements.<br />
Cash flow<br />
CONDENSED CASH FLOW STATEMENT (in EUR million) <strong>2010</strong> Change 2009 *)<br />
Cash flow from operating activities -15.1 – 5.3<br />
Cash flow from investing activities -0.4 -86 % -2.8<br />
Cash flow from financing activities 0.9 – -5.4<br />
Cash and cash equivalents at the end of the year 13.2 -52 % 27.3<br />
*) Reclassified in accordance with IFRS 5<br />
Due to the negative EBITDA and lower net cash inflow from working capital management (EUR 6.3 million compared to EUR 13.8<br />
million in 2009), the cash flow from operating activities was negative at EUR -15.1 million. As a result of the economic situation,<br />
discretionary investments were curtailed, so that there was only a cash outflow from investing activities of EUR -0.4 million.<br />
The cash flow from financing activities showed a slight rise in new debt of EUR 0.9 million.<br />
On balance, cash and cash equivalents at the end of the year fell by EUR 14.1 million to EUR 13.2 million, which can be mainly<br />
attributed to the negative cash flow from operating activities.<br />
Assets, finances and liquidity<br />
KEY BALANCE SHEET FIGURES <strong>2010</strong> Change 2009 *)<br />
Total assets in EUR million 181.4 -16 % 216.8<br />
Shareholders’ equity in EUR million -13.5 -140 % 33.4<br />
Equity ratio in % -7.4 – 15.4<br />
Working capital in EUR million 1) 24.4 -15 % 28.8<br />
Net financial liabilities in EUR million 2) 69.2 34 % 51.8<br />
Gearing in % 3) 45.0 – 36.5<br />
Liquidity ratio 4) 0.83 -35 % 1.27<br />
Market capitalization at year-end in EUR million 5) 19.2 -57 % 44.8<br />
1) Current assets (excluding cash and cash equivalents) less current liabilities (excluding financial liabilities)<br />
2) Non-current and current financial liabilities less cash and cash equivalents<br />
3) Non-current and current financial liabilities in relation to total assets<br />
4) Current assets in relation to current liabilities<br />
5) Number of shares multiplied by the share price at the end of the financial year<br />
*) Reclassified in accordance with IFRS 5<br />
35