University Education in Natural Resources - CNR Home - Utah State ...
University Education in Natural Resources - CNR Home - Utah State ...
University Education in Natural Resources - CNR Home - Utah State ...

You also want an ePaper? Increase the reach of your titles
YUMPU automatically turns print PDFs into web optimized ePapers that Google loves.
1998<br />
<strong>University</strong> <strong>Education</strong> <strong>in</strong> <strong>Natural</strong> <strong>Resources</strong> 89<br />
Note, however, that because of the 30-fold smaller concentration<br />
of carbon dioxide than water vapor <strong>in</strong> the atmosphere,<br />
the magnitude of the water fluxes will be much larger than<br />
those for CO 2<br />
. A typical value for FCO 2<br />
at noon on a sunny<br />
summer day is 1 x10 -6 kg m -2 s -1 or 20 micromoles per square<br />
meter per second. The sub-stomatal concentration C i<br />
is known<br />
to be approximately constant under normal atmospheric and<br />
plant conditions. It is about 220 ppvm for C 3<br />
plants, such as<br />
wheat, rice and potatoes, and 120 ppmv for C 4<br />
plants, such as<br />
corn and sorghum. We will have more to say about this <strong>in</strong>trigu<strong>in</strong>g<br />
parameter later <strong>in</strong> these notes. Equation 1d show us<br />
that the primary control of water use efficiency is exerted by<br />
the vapor pressure deficit between that at the leaf surface and<br />
the that above the canopy.<br />
Assum<strong>in</strong>g that the latter is largely controlled by the atmosphere,<br />
the s<strong>in</strong>gle most important variable <strong>in</strong> the WUE relationship is the<br />
vapor pressure <strong>in</strong> the leaf, which is to say that control rests with<br />
the leaf temperature. We might imag<strong>in</strong>e that the plant is try<strong>in</strong>g to<br />
maximize the WUE but, at the same time maximize its rate of<br />
carbon <strong>in</strong>take. Blum (1989) cites a formula relat<strong>in</strong>g plant yield<br />
(YE) to WUE, more specifically the product of WUE times the<br />
evapotrananspiration. He also cites another formula relat<strong>in</strong>g biomass<br />
creation to the ratio of transpiration to potential evapotranspiration,<br />
which is a little bit like the moisture availability you saw<br />
def<strong>in</strong>ed <strong>in</strong> an earlier scenario.<br />
Calculat<strong>in</strong>g the carbon dioxide assimilation rate<br />
from the <strong>in</strong>side<br />
Well beyond the scope of this course is the frighten<strong>in</strong>g terra<strong>in</strong><br />
of pure plant physiology. Nevertheless, plant physiologists are<br />
also struggl<strong>in</strong>g with the model<strong>in</strong>g aspects of assimilation rates.<br />
One of the most well known of the current assimilation models<br />
is one constructed by Farquhar (1989); of feed-forward<br />
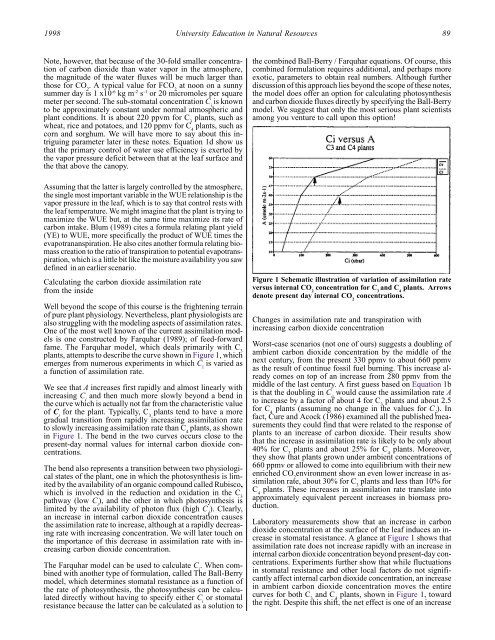
fame. The Farquhar model, which deals primarily with C 3<br />
plants, attempts to describe the curve shown <strong>in</strong> Figure 1, which<br />
emerges from numerous experiments <strong>in</strong> which C i<br />
is varied as<br />
a function of assimilation rate.<br />
We see that A <strong>in</strong>creases first rapidly and almost l<strong>in</strong>early with<br />
<strong>in</strong>creas<strong>in</strong>g C i<br />
and then much more slowly beyond a bend <strong>in</strong><br />
the curve which is actually not far from the characteristic value<br />
of C i<br />
for the plant. Typically, C 3<br />
plants tend to have a more<br />
gradual transition from rapidly <strong>in</strong>creas<strong>in</strong>g assimilation rate<br />
to slowly <strong>in</strong>creas<strong>in</strong>g assimilation rate than C 4<br />
plants, as shown<br />
<strong>in</strong> Figure 1. The bend <strong>in</strong> the two curves occurs close to the<br />
present-day normal values for <strong>in</strong>ternal carbon dioxide concentrations.<br />
The bend also represents a transition between two physiological<br />
states of the plant, one <strong>in</strong> which the photosynthesis is limited<br />
by the availability of an organic compound called Rubisco,<br />
which is <strong>in</strong>volved <strong>in</strong> the reduction and oxidation <strong>in</strong> the C 3<br />
pathway (low C i<br />
), and the other <strong>in</strong> which photosynthesis is<br />
limited by the availability of photon flux (high C i<br />
). Clearly,<br />
an <strong>in</strong>crease <strong>in</strong> <strong>in</strong>ternal carbon dioxide concentration causes<br />
the assimilation rate to <strong>in</strong>crease, although at a rapidly decreas<strong>in</strong>g<br />
rate with <strong>in</strong>creas<strong>in</strong>g concentration. We will later touch on<br />
the importance of this decrease <strong>in</strong> assimilation rate with <strong>in</strong>creas<strong>in</strong>g<br />
carbon dioxide concentration.<br />
The Farquhar model can be used to calculate C i<br />
. When comb<strong>in</strong>ed<br />
with another type of formulation, called The Ball-Berry<br />
model, which determ<strong>in</strong>es stomatal resistance as a function of<br />
the rate of photosynthesis, the photosynthesis can be calculated<br />
directly without hav<strong>in</strong>g to specify either C i<br />
or stomatal<br />
resistance because the latter can be calculated as a solution to<br />
the comb<strong>in</strong>ed Ball-Berry / Farquhar equations. Of course, this<br />
comb<strong>in</strong>ed formulation requires additional, and perhaps more<br />
exotic, parameters to obta<strong>in</strong> real numbers. Although further<br />
discussion of this approach lies beyond the scope of these notes,<br />
the model does offer an option for calculat<strong>in</strong>g photosynthesis<br />
and carbon dioxide fluxes directly by specify<strong>in</strong>g the Ball-Berry<br />
model. We suggest that only the most serious plant scientists<br />
among you venture to call upon this option!<br />
Figure 1 Schematic illustration of variation of assimilation rate<br />
versus <strong>in</strong>ternal CO 2<br />
concentration for C 3<br />
and C 4<br />
plants. Arrows<br />
denote present day <strong>in</strong>ternal CO 2<br />
concentrations.<br />
Changes <strong>in</strong> assimilation rate and transpiration with<br />
<strong>in</strong>creas<strong>in</strong>g carbon dioxide concentration<br />
Worst-case scenarios (not one of ours) suggests a doubl<strong>in</strong>g of<br />
ambient carbon dioxide concentration by the middle of the<br />
next century, from the present 330 ppmv to about 660 ppmv<br />
as the result of cont<strong>in</strong>ue fossil fuel burn<strong>in</strong>g. This <strong>in</strong>crease already<br />
comes on top of an <strong>in</strong>crease from 280 ppmv from the<br />
middle of the last century. A first guess based on Equation 1b<br />
is that the doubl<strong>in</strong>g <strong>in</strong> C a<br />
would cause the assimilation rate A<br />
to <strong>in</strong>crease by a factor of about 4 for C 3<br />
plants and about 2.5<br />
for C 4<br />
plants (assum<strong>in</strong>g no change <strong>in</strong> the values for C i<br />
). In<br />
fact, Cure and Acock (1986) exam<strong>in</strong>ed all the published measurements<br />
they could f<strong>in</strong>d that were related to the response of<br />
plants to an <strong>in</strong>crease of carbon dioxide. Their results show<br />
that the <strong>in</strong>crease <strong>in</strong> assimilation rate is likely to be only about<br />
40% for C 3<br />
plants and about 25% for C 4<br />
plants. Moreover,<br />
they show that plants grown under ambient concentrations of<br />
660 ppmv or allowed to come <strong>in</strong>to equilibrium with their new<br />
enriched CO 2<br />
environment show an even lower <strong>in</strong>crease <strong>in</strong> assimilation<br />
rate, about 30% for C 3<br />
plants and less than 10% for<br />
C 4<br />
plants. These <strong>in</strong>creases <strong>in</strong> assimilation rate translate <strong>in</strong>to<br />
approximately equivalent percent <strong>in</strong>creases <strong>in</strong> biomass production.<br />
Laboratory measurements show that an <strong>in</strong>crease <strong>in</strong> carbon<br />
dioxide concentration at the surface of the leaf <strong>in</strong>duces an <strong>in</strong>crease<br />
<strong>in</strong> stomatal resistance. A glance at Figure 1 shows that<br />
assimilation rate does not <strong>in</strong>crease rapidly with an <strong>in</strong>crease <strong>in</strong><br />
<strong>in</strong>ternal carbon dioxide concentration beyond present-day concentrations.<br />
Experiments further show that while fluctuations<br />
<strong>in</strong> stomatal resistance and other local factors do not significantly<br />
affect <strong>in</strong>ternal carbon dioxide concentration, an <strong>in</strong>crease<br />
<strong>in</strong> ambient carbon dioxide concentration moves the entire<br />
curves for both C 3<br />
and C 4<br />
plants, shown <strong>in</strong> Figure 1, toward<br />
the right. Despite this shift, the net effect is one of an <strong>in</strong>crease