University Education in Natural Resources - CNR Home - Utah State ...
University Education in Natural Resources - CNR Home - Utah State ...
University Education in Natural Resources - CNR Home - Utah State ...

Create successful ePaper yourself
Turn your PDF publications into a flip-book with our unique Google optimized e-Paper software.
90 <strong>Natural</strong> <strong>Resources</strong> and Environmental Issues Volume VII<br />
<strong>in</strong> assimilation rate even for C 4<br />
plants (although the sharper<br />
transition at the bend <strong>in</strong> the curves followed by a nearly constant<br />
value of assimilation rate of the C 4<br />
curve above the bend<br />
translates to a smaller ga<strong>in</strong> <strong>in</strong> A for C 4<br />
plants than for C 3<br />
plants with an <strong>in</strong>crease <strong>in</strong> C a<br />
).<br />
A further <strong>in</strong>trigu<strong>in</strong>g implication of Cure and Acock’s (1986)<br />
data is that transpiration should decrease by about 20% as the<br />
result of carbon dioxide doubl<strong>in</strong>g! What Figure 1 shows clearly<br />
is that an <strong>in</strong>crease of 20% <strong>in</strong> stomatal resistance is not sufficiently<br />
large to hold the assimilation rate to only a 40% <strong>in</strong>crease;<br />
rather, both C i<br />
and stomatal resistance must <strong>in</strong>crease<br />
as ambient carbon dioxide concentration is <strong>in</strong>creased. This<br />
<strong>in</strong>crease, <strong>in</strong> stomatal resistance, seems to be associated with<br />
the leaf ‘s ability to sense an <strong>in</strong>crease <strong>in</strong> carbon dioxide concentration<br />
at its surface.<br />
<strong>State</strong>d alternately, if one doubles the amount of food on the<br />
table (ambient carbon dioxide concentration), people will stuff<br />
their mouths more (<strong>in</strong>ternal carbon dioxide concentration),<br />
but they will not <strong>in</strong>gest twice as much food. Moreover, given<br />
some time to equilibrate, people may get sufficiently fed up<br />
(literally) that they will become more resistant to temptation<br />
and not <strong>in</strong>gest much more food than before, although it is<br />
certa<strong>in</strong>ly true that the more food available the more one eats<br />
(up to a po<strong>in</strong>t). Thus stomatal resistance <strong>in</strong>creases <strong>in</strong> response<br />
to the plant’s <strong>in</strong>ability to assimilate all that is put on its plate,<br />
given the amount of available sunsh<strong>in</strong>e and nutrients for carry<strong>in</strong>g<br />
out all its chemical reactions. (Speak<strong>in</strong>g of resistance,<br />
anyone who has ever tried to feed an <strong>in</strong>fant would know what<br />
happens when you try to <strong>in</strong>crease the food <strong>in</strong>take rate by <strong>in</strong>creas<strong>in</strong>g<br />
the mass of goop on the end of a spoon! You do get<br />
more <strong>in</strong>side the <strong>in</strong>fant, but a lot of resistance is put forth and a<br />
lot of goop ends up on the walls).<br />
Simulations<br />
The SVAT model calculates carbon dioxide flux and outputs it<br />
<strong>in</strong> units of kg m -2 s -1 . As with water vapor fluxes, the calculations<br />
refer to flux per unit sunlit leaf area, but the output is <strong>in</strong><br />
terms of flux per unit horizontal surface area. The problem<br />
therefore, is to scale from a leaf to a canopy. One way of deal<strong>in</strong>g<br />
with this is to calculate fluxes for each leaf or leaf strata.<br />
Another approach is to divide the leaf resistances by the leaf<br />
area <strong>in</strong>dex multiplied by a scal<strong>in</strong>g factor called a ‘shelter factor.’<br />
The reason why we divide by the leaf area <strong>in</strong>dex is that<br />
we must sum up all the <strong>in</strong>dividual leaf fluxes for one-sided<br />
transpiration. Were we to simply divide by LAI (equivalent to<br />
multiply<strong>in</strong>g the transpiration fluxes by LAI) the resultant fluxes<br />
would generally be too large because the transpir<strong>in</strong>g area would<br />
be overestimated, s<strong>in</strong>ce many leaves are shaded by other leaves<br />
and thus have a larger stomatal resistance. Accord<strong>in</strong>gly, we<br />
use an equation that reduces the leaf resistances by an amount<br />
that varies between about 1.0 for a fairly low leaf area <strong>in</strong>dex to<br />
about 2.0 for very large leaf area <strong>in</strong>dices. Both the carbon<br />
dioxide and water vapor fluxes have been scaled <strong>in</strong> this way.<br />
and transpiration dur<strong>in</strong>g the day and from the unstressed run.<br />
Use the field results of Figures 2 and 3 as a comparative platform<br />
from which to discuss the SVAT’s results for transpiration<br />
and photosynthesis.<br />
Simulation # 2.<br />
Run the case with double root / stem hydraulic resistance aga<strong>in</strong><br />
and exam<strong>in</strong>e the carbon dioxide fluxes, WUE and transpiration.<br />
Changes <strong>in</strong> the root / stem hydraulic resistance occur<br />
dur<strong>in</strong>g the life of the plant. It probably decreases <strong>in</strong> the early<br />
stages of the plant’s life and <strong>in</strong>creases aga<strong>in</strong> with time as the<br />
plant matures and then senesces.<br />
Simulation # 3.<br />
F<strong>in</strong>ally, and only if you have oodles of time to burn, check out<br />
the carbon dioxide doubl<strong>in</strong>g issue referred to by Cure and<br />
Acock (1986). First, <strong>in</strong>crease the ambient carbon dioxide concentration<br />
to 660 ppmv. Note the <strong>in</strong>crease <strong>in</strong> the fluxes of<br />
carbon dioxide from the base case and see if it is similar to the<br />
30% <strong>in</strong>crease <strong>in</strong>dicated by the results of Cure and Acock. It<br />
isn’t ! So then <strong>in</strong>crease the m<strong>in</strong>imum stomatal resistance by<br />
30% and see if you reduce the carbon dioxide fluxes by 30%.<br />
You can’t unless you also <strong>in</strong>crease C i<br />
which you can also do.<br />
So f<strong>in</strong>ally <strong>in</strong>crease the <strong>in</strong>ternal CO 2<br />
concentration until the<br />
assimilation rate is 30% above your reference case. To <strong>in</strong>crease<br />
the stomatal resistance <strong>in</strong>crease r sm<strong>in</strong><br />
by the appropriate factor.<br />
Thus, if you wish to <strong>in</strong>crease the stomatal resistance by factor<br />
of 2 simple double the m<strong>in</strong>imum stomatal resistance. At this<br />
po<strong>in</strong>t, look at the decrease <strong>in</strong> transpiration from the base case.<br />
Does that value agree with the 20% decrease anticipated by<br />
the results of Cure and Acock ? If not, is the model full of<br />
baloney? Are Cure and Acock out to lunch ? Or is someth<strong>in</strong>g<br />
up here that is a little more profound than scientific sill<strong>in</strong>ess ?<br />
SUPPLEMENTARY FIGURES<br />
Simulation # 1.<br />
Re-run the base case simulation, but this time exam<strong>in</strong>e the<br />
carbon dioxide fluxes and the water vapor fluxes together.<br />
Don’t forget to use a large LAI <strong>in</strong> order to effectively suppress<br />
the evaporation component of the evapotranspiration. (We will<br />
output the transpiration <strong>in</strong> the same units to make it easier for<br />
you to compute a WUE ratio). Then run a simulation <strong>in</strong> which<br />
water stress manifests itself as a plateau <strong>in</strong> the evapotranspiration<br />
and note the changes <strong>in</strong> WUE, carbon dioxide fluxes<br />
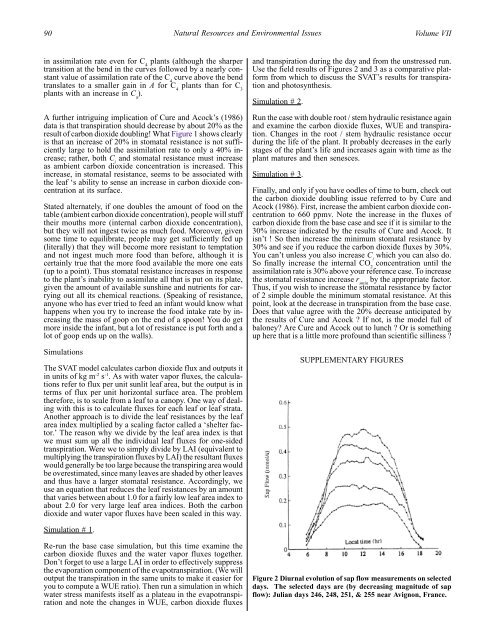
Figure 2 Diurnal evolution of sap flow measurements on selected<br />
days. The selected days are (by decreas<strong>in</strong>g magnitude of sap<br />
flow): Julian days 246, 248, 251, & 255 near Avignon, France.