Consolidated profit and loss account - Stagecoach Group
Consolidated profit and loss account - Stagecoach Group
Consolidated profit and loss account - Stagecoach Group

You also want an ePaper? Increase the reach of your titles
YUMPU automatically turns print PDFs into web optimized ePapers that Google loves.
Notes to the <strong>account</strong>s 2003<br />
Note 2 Segmental analysis (continued)<br />
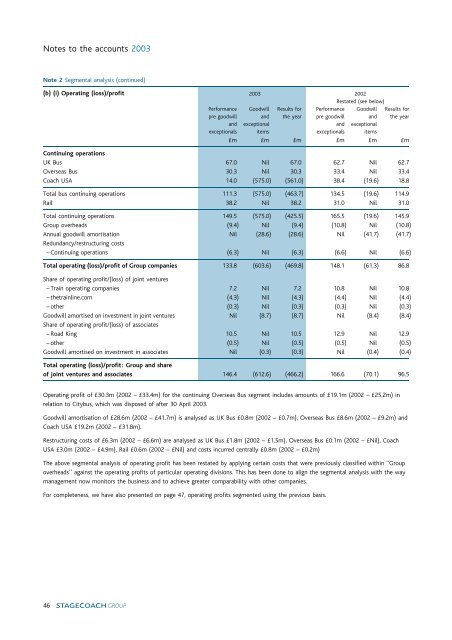
(b) (i) Operating (<strong>loss</strong>)/<strong>profit</strong> 2003 2002<br />
Restated (see below)<br />
Performance Goodwill Results for Performance Goodwill Results for<br />
pre goodwill <strong>and</strong> the year pre goodwill <strong>and</strong> the year<br />
<strong>and</strong> exceptional <strong>and</strong> exceptional<br />
exceptionals items exceptionals items<br />
»m »m »m »m »m »m<br />
Continuing operations<br />
UK Bus 67.0 Nil 67.0 62.7 Nil 62.7<br />
Overseas Bus 30.3 Nil 30.3 33.4 Nil 33.4<br />
Coach USA 14.0 (575.0) (561.0) 38.4 (19.6) 18.8<br />
Total bus continuing operations 111.3 (575.0) (463.7) 134.5 (19.6) 114.9<br />
Rail 38.2 Nil 38.2 31.0 Nil 31.0<br />
Total continuing operations 149.5 (575.0) (425.5) 165.5 (19.6) 145.9<br />
<strong>Group</strong> overheads (9.4) Nil (9.4) (10.8) Nil (10.8)<br />
Annual goodwill amortisation Nil (28.6) (28.6) Nil (41.7) (41.7)<br />
Redundancy/restructuring costs<br />
^ Continuing operations (6.3) Nil (6.3) (6.6) Nil (6.6)<br />
Total operating (<strong>loss</strong>)/<strong>profit</strong> of <strong>Group</strong> companies 133.8 (603.6) (469.8) 148.1 (61.3) 86.8<br />
Share of operating <strong>profit</strong>/(<strong>loss</strong>) of joint ventures<br />
^ Train operating companies 7.2 Nil 7.2 10.8 Nil 10.8<br />
^ thetrainline.com (4.3) Nil (4.3) (4.4) Nil (4.4)<br />
^ other (0.3) Nil (0.3) (0.3) Nil (0.3)<br />
Goodwill amortised on investment in joint ventures Nil (8.7) (8.7) Nil (8.4) (8.4)<br />
Share of operating <strong>profit</strong>/(<strong>loss</strong>) of associates<br />
^ Road King 10.5 Nil 10.5 12.9 Nil 12.9<br />
^ other (0.5) Nil (0.5) (0.5) Nil (0.5)<br />
Goodwill amortised on investment in associates Nil (0.3) (0.3) Nil (0.4) (0.4)<br />
Total operating (<strong>loss</strong>)/<strong>profit</strong>: <strong>Group</strong> <strong>and</strong> share<br />
of joint ventures <strong>and</strong> associates 146.4 (612.6) (466.2) 166.6 (70.1) 96.5<br />
Operating <strong>profit</strong> of »30.3m (2002 ^ »33.4m) for the continuing Overseas Bus segment includes amounts of »19.1m (2002 ^ »25.2m) in<br />
relation to Citybus, which was disposed of after 30 April 2003.<br />
Goodwill amortisation of »28.6m (2002 ^ »41.7m) is analysed as UK Bus »0.8m (2002 ^ »0.7m), Overseas Bus »8.6m (2002 ^ »9.2m) <strong>and</strong><br />
Coach USA »19.2m (2002 ^ »31.8m).<br />
Restructuring costs of »6.3m (2002 ^ »6.6m) are analysed as UK Bus »1.8m (2002 ^ »1.5m), Overseas Bus »0.1m (2002 ^ »Nil), Coach<br />
USA »3.0m (2002 ^ »4.9m), Rail »0.6m (2002 ^ »Nil) <strong>and</strong> costs incurred centrally »0.8m (2002 ^ »0.2m)<br />
The above segmental analysis of operating <strong>profit</strong> has been restated by applying certain costs that were previously classified within ‘‘<strong>Group</strong><br />
overheads’’ against the operating <strong>profit</strong>s of particular operating divisions. This has been done to align the segmental analysis with the way<br />
management now monitors the business <strong>and</strong> to achieve greater comparability with other companies.<br />
For completeness, we have also presented on page 47, operating <strong>profit</strong>s segmented using the previous basis.<br />
46