Subject index - Stata
Subject index - Stata
Subject index - Stata
Create successful ePaper yourself
Turn your PDF publications into a flip-book with our unique Google optimized e-Paper software.
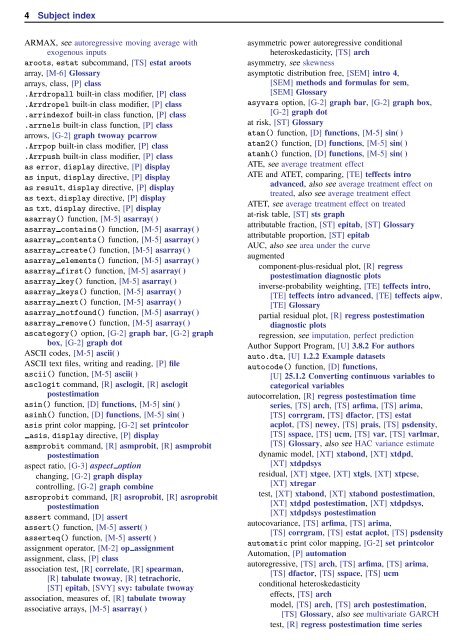
4 <strong>Subject</strong> <strong>index</strong><br />
ARMAX, see autoregressive moving average with<br />
exogenous inputs<br />
aroots, estat subcommand, [TS] estat aroots<br />
array, [M-6] Glossary<br />
arrays, class, [P] class<br />
.Arrdropall built-in class modifier, [P] class<br />
.Arrdropel built-in class modifier, [P] class<br />
.arr<strong>index</strong>of built-in class function, [P] class<br />
.arrnels built-in class function, [P] class<br />
arrows, [G-2] graph twoway pcarrow<br />
.Arrpop built-in class modifier, [P] class<br />
.Arrpush built-in class modifier, [P] class<br />
as error, display directive, [P] display<br />
as input, display directive, [P] display<br />
as result, display directive, [P] display<br />
as text, display directive, [P] display<br />
as txt, display directive, [P] display<br />
asarray() function, [M-5] asarray( )<br />
asarray contains() function, [M-5] asarray( )<br />
asarray contents() function, [M-5] asarray( )<br />
asarray create() function, [M-5] asarray( )<br />
asarray elements() function, [M-5] asarray( )<br />
asarray first() function, [M-5] asarray( )<br />
asarray key() function, [M-5] asarray( )<br />
asarray keys() function, [M-5] asarray( )<br />
asarray next() function, [M-5] asarray( )<br />
asarray notfound() function, [M-5] asarray( )<br />
asarray remove() function, [M-5] asarray( )<br />
ascategory() option, [G-2] graph bar, [G-2] graph<br />
box, [G-2] graph dot<br />
ASCII codes, [M-5] ascii( )<br />
ASCII text files, writing and reading, [P] file<br />
ascii() function, [M-5] ascii( )<br />
asclogit command, [R] asclogit, [R] asclogit<br />
postestimation<br />
asin() function, [D] functions, [M-5] sin( )<br />
asinh() function, [D] functions, [M-5] sin( )<br />
asis print color mapping, [G-2] set printcolor<br />
asis, display directive, [P] display<br />
asmprobit command, [R] asmprobit, [R] asmprobit<br />
postestimation<br />
aspect ratio, [G-3] aspect option<br />
changing, [G-2] graph display<br />
controlling, [G-2] graph combine<br />
asroprobit command, [R] asroprobit, [R] asroprobit<br />
postestimation<br />
assert command, [D] assert<br />
assert() function, [M-5] assert( )<br />
asserteq() function, [M-5] assert( )<br />
assignment operator, [M-2] op assignment<br />
assignment, class, [P] class<br />
association test, [R] correlate, [R] spearman,<br />
[R] tabulate twoway, [R] tetrachoric,<br />
[ST] epitab, [SVY] svy: tabulate twoway<br />
association, measures of, [R] tabulate twoway<br />
associative arrays, [M-5] asarray( )<br />
asymmetric power autoregressive conditional<br />
heteroskedasticity, [TS] arch<br />
asymmetry, see skewness<br />
asymptotic distribution free, [SEM] intro 4,<br />
[SEM] methods and formulas for sem,<br />
[SEM] Glossary<br />
asyvars option, [G-2] graph bar, [G-2] graph box,<br />
[G-2] graph dot<br />
at risk, [ST] Glossary<br />
atan() function, [D] functions, [M-5] sin( )<br />
atan2() function, [D] functions, [M-5] sin( )<br />
atanh() function, [D] functions, [M-5] sin( )<br />
ATE, see average treatment effect<br />
ATE and ATET, comparing, [TE] teffects intro<br />
advanced, also see average treatment effect on<br />
treated, also see average treatment effect<br />
ATET, see average treatment effect on treated<br />
at-risk table, [ST] sts graph<br />
attributable fraction, [ST] epitab, [ST] Glossary<br />
attributable proportion, [ST] epitab<br />
AUC, also see area under the curve<br />
augmented<br />
component-plus-residual plot, [R] regress<br />
postestimation diagnostic plots<br />
inverse-probability weighting, [TE] teffects intro,<br />
[TE] teffects intro advanced, [TE] teffects aipw,<br />
[TE] Glossary<br />
partial residual plot, [R] regress postestimation<br />
diagnostic plots<br />
regression, see imputation, perfect prediction<br />
Author Support Program, [U] 3.8.2 For authors<br />
auto.dta, [U] 1.2.2 Example datasets<br />
autocode() function, [D] functions,<br />
[U] 25.1.2 Converting continuous variables to<br />
categorical variables<br />
autocorrelation, [R] regress postestimation time<br />
series, [TS] arch, [TS] arfima, [TS] arima,<br />
[TS] corrgram, [TS] dfactor, [TS] estat<br />
acplot, [TS] newey, [TS] prais, [TS] psdensity,<br />
[TS] sspace, [TS] ucm, [TS] var, [TS] varlmar,<br />
[TS] Glossary, also see HAC variance estimate<br />
dynamic model, [XT] xtabond, [XT] xtdpd,<br />
[XT] xtdpdsys<br />
residual, [XT] xtgee, [XT] xtgls, [XT] xtpcse,<br />
[XT] xtregar<br />
test, [XT] xtabond, [XT] xtabond postestimation,<br />
[XT] xtdpd postestimation, [XT] xtdpdsys,<br />
[XT] xtdpdsys postestimation<br />
autocovariance, [TS] arfima, [TS] arima,<br />
[TS] corrgram, [TS] estat acplot, [TS] psdensity<br />
automatic print color mapping, [G-2] set printcolor<br />
Automation, [P] automation<br />
autoregressive, [TS] arch, [TS] arfima, [TS] arima,<br />
[TS] dfactor, [TS] sspace, [TS] ucm<br />
conditional heteroskedasticity<br />
effects, [TS] arch<br />
model, [TS] arch, [TS] arch postestimation,<br />
[TS] Glossary, also see multivariate GARCH<br />
test, [R] regress postestimation time series


