Subject index - Stata
Subject index - Stata
Subject index - Stata
You also want an ePaper? Increase the reach of your titles
YUMPU automatically turns print PDFs into web optimized ePapers that Google loves.
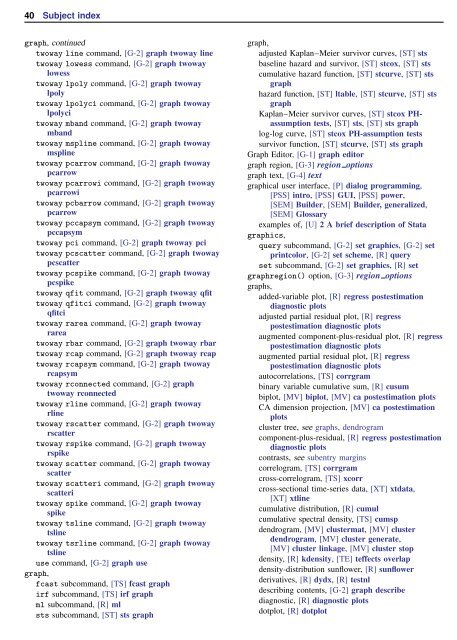
40 <strong>Subject</strong> <strong>index</strong><br />
graph, continued<br />
twoway line command, [G-2] graph twoway line<br />
twoway lowess command, [G-2] graph twoway<br />
lowess<br />
twoway lpoly command, [G-2] graph twoway<br />
lpoly<br />
twoway lpolyci command, [G-2] graph twoway<br />
lpolyci<br />
twoway mband command, [G-2] graph twoway<br />
mband<br />
twoway mspline command, [G-2] graph twoway<br />
mspline<br />
twoway pcarrow command, [G-2] graph twoway<br />
pcarrow<br />
twoway pcarrowi command, [G-2] graph twoway<br />
pcarrowi<br />
twoway pcbarrow command, [G-2] graph twoway<br />
pcarrow<br />
twoway pccapsym command, [G-2] graph twoway<br />
pccapsym<br />
twoway pci command, [G-2] graph twoway pci<br />
twoway pcscatter command, [G-2] graph twoway<br />
pcscatter<br />
twoway pcspike command, [G-2] graph twoway<br />
pcspike<br />
twoway qfit command, [G-2] graph twoway qfit<br />
twoway qfitci command, [G-2] graph twoway<br />
qfitci<br />
twoway rarea command, [G-2] graph twoway<br />
rarea<br />
twoway rbar command, [G-2] graph twoway rbar<br />
twoway rcap command, [G-2] graph twoway rcap<br />
twoway rcapsym command, [G-2] graph twoway<br />
rcapsym<br />
twoway rconnected command, [G-2] graph<br />
twoway rconnected<br />
twoway rline command, [G-2] graph twoway<br />
rline<br />
twoway rscatter command, [G-2] graph twoway<br />
rscatter<br />
twoway rspike command, [G-2] graph twoway<br />
rspike<br />
twoway scatter command, [G-2] graph twoway<br />
scatter<br />
twoway scatteri command, [G-2] graph twoway<br />
scatteri<br />
twoway spike command, [G-2] graph twoway<br />
spike<br />
twoway tsline command, [G-2] graph twoway<br />
tsline<br />
twoway tsrline command, [G-2] graph twoway<br />
tsline<br />
use command, [G-2] graph use<br />
graph,<br />
fcast subcommand, [TS] fcast graph<br />
irf subcommand, [TS] irf graph<br />
ml subcommand, [R] ml<br />
sts subcommand, [ST] sts graph<br />
graph,<br />
adjusted Kaplan–Meier survivor curves, [ST] sts<br />
baseline hazard and survivor, [ST] stcox, [ST] sts<br />
cumulative hazard function, [ST] stcurve, [ST] sts<br />
graph<br />
hazard function, [ST] ltable, [ST] stcurve, [ST] sts<br />
graph<br />
Kaplan–Meier survivor curves, [ST] stcox PHassumption<br />
tests, [ST] sts, [ST] sts graph<br />
log-log curve, [ST] stcox PH-assumption tests<br />
survivor function, [ST] stcurve, [ST] sts graph<br />
Graph Editor, [G-1] graph editor<br />
graph region, [G-3] region options<br />
graph text, [G-4] text<br />
graphical user interface, [P] dialog programming,<br />
[PSS] intro, [PSS] GUI, [PSS] power,<br />
[SEM] Builder, [SEM] Builder, generalized,<br />
[SEM] Glossary<br />
examples of, [U] 2 A brief description of <strong>Stata</strong><br />
graphics,<br />
query subcommand, [G-2] set graphics, [G-2] set<br />
printcolor, [G-2] set scheme, [R] query<br />
set subcommand, [G-2] set graphics, [R] set<br />
graphregion() option, [G-3] region options<br />
graphs,<br />
added-variable plot, [R] regress postestimation<br />
diagnostic plots<br />
adjusted partial residual plot, [R] regress<br />
postestimation diagnostic plots<br />
augmented component-plus-residual plot, [R] regress<br />
postestimation diagnostic plots<br />
augmented partial residual plot, [R] regress<br />
postestimation diagnostic plots<br />
autocorrelations, [TS] corrgram<br />
binary variable cumulative sum, [R] cusum<br />
biplot, [MV] biplot, [MV] ca postestimation plots<br />
CA dimension projection, [MV] ca postestimation<br />
plots<br />
cluster tree, see graphs, dendrogram<br />
component-plus-residual, [R] regress postestimation<br />
diagnostic plots<br />
contrasts, see subentry margins<br />
correlogram, [TS] corrgram<br />
cross-correlogram, [TS] xcorr<br />
cross-sectional time-series data, [XT] xtdata,<br />
[XT] xtline<br />
cumulative distribution, [R] cumul<br />
cumulative spectral density, [TS] cumsp<br />
dendrogram, [MV] clustermat, [MV] cluster<br />
dendrogram, [MV] cluster generate,<br />
[MV] cluster linkage, [MV] cluster stop<br />
density, [R] kdensity, [TE] teffects overlap<br />
density-distribution sunflower, [R] sunflower<br />
derivatives, [R] dydx, [R] testnl<br />
describing contents, [G-2] graph describe<br />
diagnostic, [R] diagnostic plots<br />
dotplot, [R] dotplot


