


Create successful ePaper yourself
Turn your PDF publications into a flip-book with our unique Google optimized e-Paper software.
Title<br />
stata.com<br />
<strong>xtline</strong> — Panel-data line plots<br />
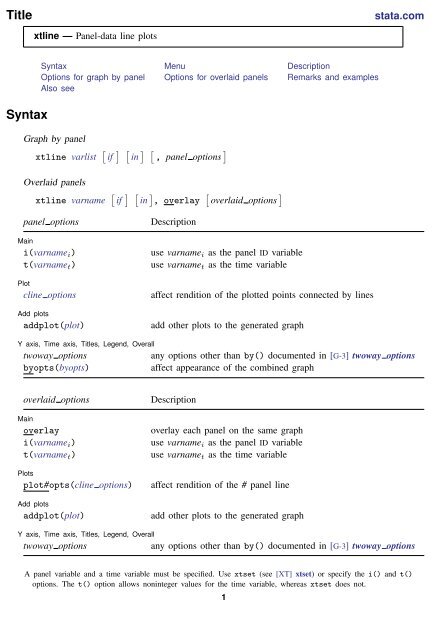
Syntax<br />
Syntax Menu Description<br />
Options for graph by panel Options for overlaid panels Remarks and examples<br />
Also see<br />
Graph by panel<br />
<strong>xtline</strong> varlist [ if ] [ in ] [ , panel options ]<br />
Overlaid panels<br />
<strong>xtline</strong> varname [ if ] [ in ] , overlay [ overlaid options ]<br />
panel options<br />
Main<br />
i(varname i )<br />
t(varname t )<br />
Plot<br />
cline options<br />
Add plots<br />
addplot(plot)<br />
Description<br />
use varname i as the panel ID variable<br />
use varname t as the time variable<br />
affect rendition of the plotted points connected by lines<br />
add other plots to the generated graph<br />
Y axis, Time axis, Titles, Legend, Overall<br />
twoway options<br />
any options other than by() documented in [G-3] twoway options<br />
byopts(byopts)<br />
affect appearance of the combined graph<br />
overlaid options<br />
Main<br />
overlay<br />
i(varname i )<br />
t(varname t )<br />
Plots<br />
plot#opts(cline options)<br />
Add plots<br />
addplot(plot)<br />
Description<br />
overlay each panel on the same graph<br />
use varname i as the panel ID variable<br />
use varname t as the time variable<br />
affect rendition of the # panel line<br />
add other plots to the generated graph<br />
Y axis, Time axis, Titles, Legend, Overall<br />
twoway options<br />
any options other than by() documented in [G-3] twoway options<br />
A panel variable and a time variable must be specified. Use xtset (see [XT] xtset) or specify the i() and t()<br />
options. The t() option allows noninteger values for the time variable, whereas xtset does not.<br />
1
2 <strong>xtline</strong> — Panel-data line plots<br />
Menu<br />
Statistics > Longitudinal/panel data > Line plots<br />
Description<br />
<strong>xtline</strong> draws line plots for panel data.<br />
Options for graph by panel<br />
✄<br />
✄<br />
Main<br />
<br />
i(varname i ) and t(varname t ) override the panel settings from xtset; see [XT] xtset. varname i is<br />
allowed to be a string variable. varname t can take on noninteger values and have repeated values<br />
within panel. That is to say, it can be any numeric variable that you would like to specify for the<br />
x-dimension of the graph. It is an error to specify i() without t() and vice versa.<br />
✄ <br />
✄ Plot<br />
cline options affect the rendition of the plotted points connected by lines; see [G-3] cline options.<br />
✄<br />
✄ <br />
Add plots<br />
<br />
addplot(plot) provides a way to add other plots to the generated graph; see [G-3] addplot option.<br />
✄<br />
✄<br />
Y axis, Time axis, Titles, Legend, Overall<br />
<br />
twoway options are any of the options documented in [G-3] twoway options, excluding by(). These<br />
include options for titling the graph (see [G-3] title options) and for saving the graph to disk (see<br />
[G-3] saving option).<br />
byopts(byopts) allows all the options documented in [G-3] by option. These options affect the<br />
appearance of the by-graph. byopts() may not be combined with overlay.<br />
Options for overlaid panels<br />
✄<br />
✄<br />
✄<br />
Main<br />
<br />
overlay causes the plot from each panel to be overlaid on the same graph. The default is to generate<br />
plots by panel. This option may not be combined with byopts() or be specified when there are<br />
multiple variables in varlist.<br />
i(varname i ) and t(varname t ) override the panel settings from xtset; see [XT] xtset. varname i is<br />
allowed to be a string variable. varname t can take on noninteger values and have repeated values<br />
within panel. That is to say, it can be any numeric variable that you would like to specify for the<br />
x-dimension of the graph. It is an error to specify i() without t() and vice versa.<br />
✄<br />
Plots<br />
<br />
plot#opts(cline options) affect the rendition of the #th panel (in sorted order). The cline options<br />
can affect whether and how the points are connected; see [G-3] cline options.<br />
✄<br />
✄ <br />
Add plots<br />
<br />
addplot(plot) provides a way to add other plots to the generated graph; see [G-3] addplot option.
✄<br />
✄<br />
Y axis, Time axis, Titles, Legend, Overall<br />
<br />
<strong>xtline</strong> — Panel-data line plots 3<br />
twoway options are any of the options documented in [G-3] twoway options, excluding by(). These<br />
include options for titling the graph (see [G-3] title options) and for saving the graph to disk (see<br />
[G-3] saving option).<br />
<br />
Remarks and examples<br />
stata.com<br />
Example 1<br />
Suppose that Tess, Sam, and Arnold kept a calorie log for an entire calendar year. At the end of<br />
the year, if they pooled their data together, they would have a dataset (for example, <strong>xtline</strong>1.dta)<br />
that contains the number of calories each of them consumed for 365 days. They could then use xtset<br />
to identify the date variable and treat each person as a panel and use <strong>xtline</strong> to plot the calories<br />
versus time for each person separately.<br />
. use http://www.stata-press.com/data/r13/<strong>xtline</strong>1<br />
. xtset person day<br />
panel variable:<br />
time variable:<br />
delta:<br />
. <strong>xtline</strong> calories, tlabel(#3)<br />
person (strongly balanced)<br />
day, 01jan2002 to 31dec2002<br />
1 day<br />
Calories consumed<br />
3500 4000 4500 5000 3500 4000 4500 5000<br />
Tess<br />
Sam<br />
01jan2002 01jul2002 01jan2003<br />
Arnold<br />
01jan2002 01jul2002 01jan2003<br />
Date<br />
Graphs by person<br />
Specify the overlay option so that the values are plotted on the same graph to provide a better<br />
comparison among Tess, Sam, and Arnold.
4 <strong>xtline</strong> — Panel-data line plots<br />
. <strong>xtline</strong> calories, overlay<br />
Calories consumed<br />
3500 4000 4500 5000<br />
01jan2002 01apr2002 01jul2002 01oct2002 01jan2003<br />
Date<br />
Tess<br />
Arnold<br />
Sam<br />
Also see<br />
[XT] xtset — Declare data to be panel data<br />
[G-2] graph twoway — Twoway graphs<br />
[TS] tsline — Plot time-series data


