


You also want an ePaper? Increase the reach of your titles
YUMPU automatically turns print PDFs into web optimized ePapers that Google loves.
✄<br />
✄<br />
Y axis, Time axis, Titles, Legend, Overall<br />
<br />
<strong>xtline</strong> — Panel-data line plots 3<br />
twoway options are any of the options documented in [G-3] twoway options, excluding by(). These<br />
include options for titling the graph (see [G-3] title options) and for saving the graph to disk (see<br />
[G-3] saving option).<br />
<br />
Remarks and examples<br />
stata.com<br />
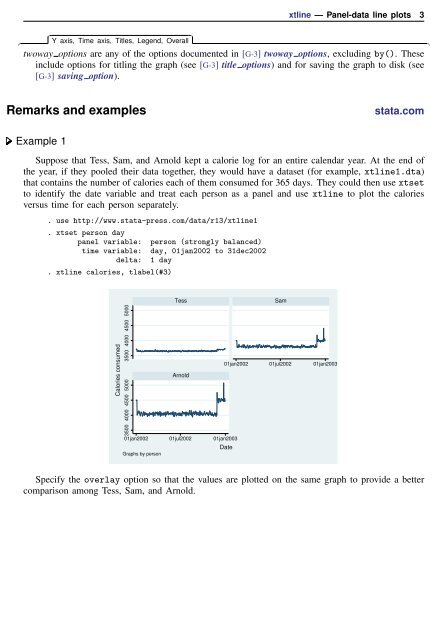
Example 1<br />
Suppose that Tess, Sam, and Arnold kept a calorie log for an entire calendar year. At the end of<br />
the year, if they pooled their data together, they would have a dataset (for example, <strong>xtline</strong>1.dta)<br />
that contains the number of calories each of them consumed for 365 days. They could then use xtset<br />
to identify the date variable and treat each person as a panel and use <strong>xtline</strong> to plot the calories<br />
versus time for each person separately.<br />
. use http://www.stata-press.com/data/r13/<strong>xtline</strong>1<br />
. xtset person day<br />
panel variable:<br />
time variable:<br />
delta:<br />
. <strong>xtline</strong> calories, tlabel(#3)<br />
person (strongly balanced)<br />
day, 01jan2002 to 31dec2002<br />
1 day<br />
Calories consumed<br />
3500 4000 4500 5000 3500 4000 4500 5000<br />
Tess<br />
Sam<br />
01jan2002 01jul2002 01jan2003<br />
Arnold<br />
01jan2002 01jul2002 01jan2003<br />
Date<br />
Graphs by person<br />
Specify the overlay option so that the values are plotted on the same graph to provide a better<br />
comparison among Tess, Sam, and Arnold.


