xtlogit - Stata
xtlogit - Stata
xtlogit - Stata
You also want an ePaper? Increase the reach of your titles
YUMPU automatically turns print PDFs into web optimized ePapers that Google loves.
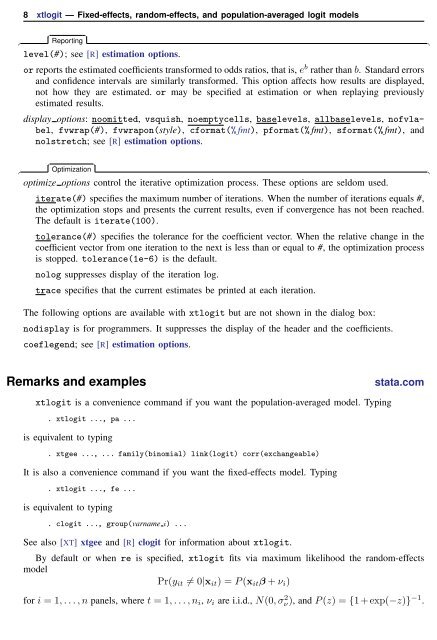
8 <strong>xtlogit</strong> — Fixed-effects, random-effects, and population-averaged logit models<br />
✄ <br />
✄ Reporting<br />
level(#); see [R] estimation options.<br />
or reports the estimated coefficients transformed to odds ratios, that is, e b rather than b. Standard errors<br />
and confidence intervals are similarly transformed. This option affects how results are displayed,<br />
not how they are estimated. or may be specified at estimation or when replaying previously<br />
estimated results.<br />
display options: noomitted, vsquish, noemptycells, baselevels, allbaselevels, nofvlabel,<br />
fvwrap(#), fvwrapon(style), cformat(% fmt), pformat(% fmt), sformat(% fmt), and<br />
nolstretch; see [R] estimation options.<br />
✄ <br />
✄ Optimization<br />
optimize options control the iterative optimization process. These options are seldom used.<br />
iterate(#) specifies the maximum number of iterations. When the number of iterations equals #,<br />
the optimization stops and presents the current results, even if convergence has not been reached.<br />
The default is iterate(100).<br />
tolerance(#) specifies the tolerance for the coefficient vector. When the relative change in the<br />
coefficient vector from one iteration to the next is less than or equal to #, the optimization process<br />
is stopped. tolerance(1e-6) is the default.<br />
nolog suppresses display of the iteration log.<br />
trace specifies that the current estimates be printed at each iteration.<br />
The following options are available with <strong>xtlogit</strong> but are not shown in the dialog box:<br />
nodisplay is for programmers. It suppresses the display of the header and the coefficients.<br />
coeflegend; see [R] estimation options.<br />
<br />
<br />
Remarks and examples<br />
stata.com<br />
<strong>xtlogit</strong> is a convenience command if you want the population-averaged model. Typing<br />
. <strong>xtlogit</strong> . . ., pa . . .<br />
is equivalent to typing<br />
. xtgee . . ., . . . family(binomial) link(logit) corr(exchangeable)<br />
It is also a convenience command if you want the fixed-effects model. Typing<br />
. <strong>xtlogit</strong> . . ., fe . . .<br />
is equivalent to typing<br />
. clogit . . ., group(varname i) . . .<br />
See also [XT] xtgee and [R] clogit for information about <strong>xtlogit</strong>.<br />
By default or when re is specified, <strong>xtlogit</strong> fits via maximum likelihood the random-effects<br />
model<br />
Pr(y it ≠ 0|x it ) = P (x it β + ν i )<br />
for i = 1, . . . , n panels, where t = 1, . . . , n i , ν i are i.i.d., N(0, σ 2 ν), and P (z) = {1 + exp(−z)} −1 .


