Systems Analysis of Zaragoza Urban Water - SWITCH - Managing ...
Systems Analysis of Zaragoza Urban Water - SWITCH - Managing ...
Systems Analysis of Zaragoza Urban Water - SWITCH - Managing ...

Create successful ePaper yourself
Turn your PDF publications into a flip-book with our unique Google optimized e-Paper software.
<strong>Systems</strong> <strong>Analysis</strong> <strong>of</strong> <strong>Zaragoza</strong> UWS<br />
Guillermo Penagos<br />
treatment in <strong>Zaragoza</strong> requires large amounts <strong>of</strong> chemical reagents implying not jus<br />
a high cost <strong>of</strong> water treatment, but also a risk to public health due to DBPs.<br />
Shifting to a different raw water source and thereby reducing treatment cost and<br />
improving water quality is a strong need for the city. From 2008 the city will receive<br />
water from the Pyrenees, specifically from the Yesa reservoir which regulates the<br />
Aragon River and is also used for irrigation and hydropower production. A significant<br />
improvement <strong>of</strong> tap water quality for <strong>Zaragoza</strong> is expected from this new source. This<br />
will be discussed further on in the Scenario <strong>Analysis</strong> section.<br />
4.2.1.2 Storm water<br />
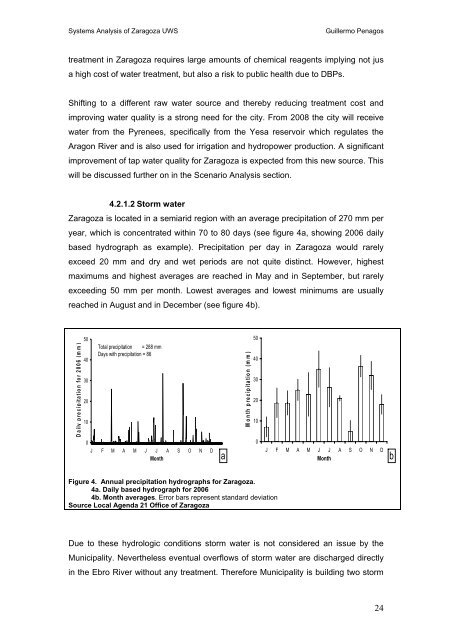
<strong>Zaragoza</strong> is located in a semiarid region with an average precipitation <strong>of</strong> 270 mm per<br />
year, which is concentrated within 70 to 80 days (see figure 4a, showing 2006 daily<br />
based hydrograph as example). Precipitation per day in <strong>Zaragoza</strong> would rarely<br />
exceed 20 mm and dry and wet periods are not quite distinct. However, highest<br />
maximums and highest averages are reached in May and in September, but rarely<br />
exceeding 50 mm per month. Lowest averages and lowest minimums are usually<br />
reached in August and in December (see figure 4b).<br />
Daily p recip itation for 2006 ( mm)<br />
50<br />
40<br />
30<br />
20<br />
10<br />
0<br />
Total precipitation = 288 mm<br />
Days with precipitation = 86<br />
J F M A M J J A S O N D<br />
Month<br />
a<br />
Month p recip itation (m m)<br />
50<br />
40<br />
30<br />
20<br />
10<br />
0<br />
J F M A M J J A S O N D<br />
Month<br />
b<br />
Figure 4. Annual precipitation hydrographs for <strong>Zaragoza</strong>.<br />
4a. Daily based hydrograph for 2006<br />
4b. Month averages. Error bars represent standard deviation<br />
Source Local Agenda 21 Office <strong>of</strong> <strong>Zaragoza</strong><br />
Due to these hydrologic conditions storm water is not considered an issue by the<br />
Municipality. Nevertheless eventual overflows <strong>of</strong> storm water are discharged directly<br />
in the Ebro River without any treatment. Therefore Municipality is building two storm<br />
24