Systems Analysis of Zaragoza Urban Water - SWITCH - Managing ...
Systems Analysis of Zaragoza Urban Water - SWITCH - Managing ...
Systems Analysis of Zaragoza Urban Water - SWITCH - Managing ...

You also want an ePaper? Increase the reach of your titles
YUMPU automatically turns print PDFs into web optimized ePapers that Google loves.
<strong>Systems</strong> <strong>Analysis</strong> <strong>of</strong> <strong>Zaragoza</strong> UWS<br />
Guillermo Penagos<br />
consumption would be 0.16 and 0.51 Gwh per year for 10% and 30% recycling<br />
respectively. However the energy savings supposed by tap water recycling are so<br />
significant, that <strong>Zaragoza</strong> taken as a whole system will be actually consuming slightly<br />
less energy if Industrial water recycling is implemented (see figure 22).<br />
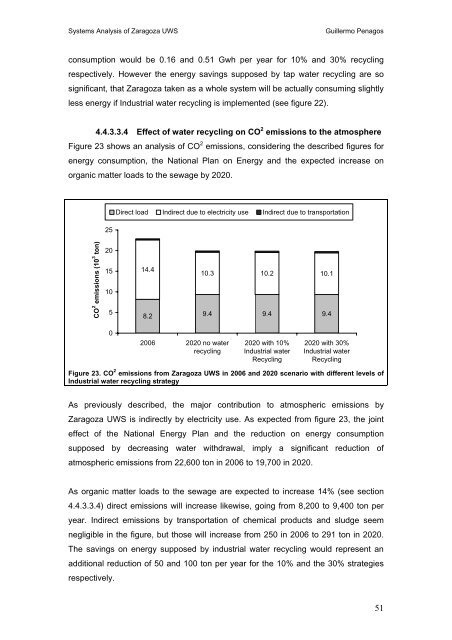
4.4.3.3.4 Effect <strong>of</strong> water recycling on CO 2 emissions to the atmosphere<br />
Figure 23 shows an analysis <strong>of</strong> CO 2 emissions, considering the described figures for<br />
energy consumption, the National Plan on Energy and the expected increase on<br />
organic matter loads to the sewage by 2020.<br />
25<br />
Direct load Indirect due to electricity use Indirect due to transportation<br />
CO 2 emissions (10 3 ton)<br />
20<br />
15<br />
10<br />
5<br />
14.4<br />
10.3 10.2 10.1<br />
8.2 9.4 9.4 9.4<br />
0<br />
2006 2020 no water<br />
recycling<br />
2020 with 10%<br />
Industrial water<br />
Recycling<br />
2020 with 30%<br />
Industrial water<br />
Recycling<br />
Figure 23. CO 2 emissions from <strong>Zaragoza</strong> UWS in 2006 and 2020 scenario with different levels <strong>of</strong><br />
Industrial water recycling strategy<br />
As previously described, the major contribution to atmospheric emissions by<br />
<strong>Zaragoza</strong> UWS is indirectly by electricity use. As expected from figure 23, the joint<br />
effect <strong>of</strong> the National Energy Plan and the reduction on energy consumption<br />
supposed by decreasing water withdrawal, imply a significant reduction <strong>of</strong><br />
atmospheric emissions from 22,600 ton in 2006 to 19,700 in 2020.<br />
As organic matter loads to the sewage are expected to increase 14% (see section<br />
4.4.3.3.4) direct emissions will increase likewise, going from 8,200 to 9,400 ton per<br />
year. Indirect emissions by transportation <strong>of</strong> chemical products and sludge seem<br />
negligible in the figure, but those will increase from 250 in 2006 to 291 ton in 2020.<br />
The savings on energy supposed by industrial water recycling would represent an<br />
additional reduction <strong>of</strong> 50 and 100 ton per year for the 10% and the 30% strategies<br />
respectively.<br />
51