Systems Analysis of Zaragoza Urban Water - SWITCH - Managing ...
Systems Analysis of Zaragoza Urban Water - SWITCH - Managing ...
Systems Analysis of Zaragoza Urban Water - SWITCH - Managing ...

Create successful ePaper yourself
Turn your PDF publications into a flip-book with our unique Google optimized e-Paper software.
<strong>Systems</strong> <strong>Analysis</strong> <strong>of</strong> <strong>Zaragoza</strong> UWS<br />
Guillermo Penagos<br />
4.4.3.5 Setting priorities for pollution loads<br />
This report provides insights about the environmental impacts <strong>of</strong> <strong>Zaragoza</strong> UWS<br />
operation on a year basis. However such impacts are not constant all over the year<br />
and might vary seasonally. In fact, even if pollution loads remained constant all over<br />
the year, there will be a seasonal variation <strong>of</strong> the receiving environment. This is more<br />
evident for the water bodies and is remarkable for the Ebro River which exhibits an<br />
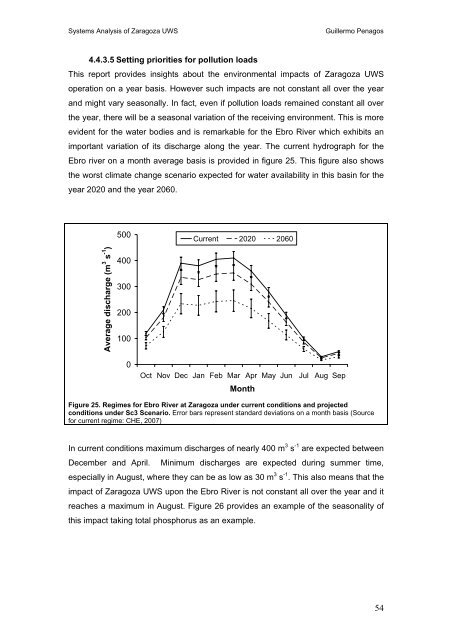
important variation <strong>of</strong> its discharge along the year. The current hydrograph for the<br />
Ebro river on a month average basis is provided in figure 25. This figure also shows<br />
the worst climate change scenario expected for water availability in this basin for the<br />
year 2020 and the year 2060.<br />
500<br />
Current 2020 2060<br />
Average discharge (m 3 s -1 )<br />
400<br />
300<br />
200<br />
100<br />
0<br />
Oct Nov Dec Jan Feb Mar Apr May Jun Jul Aug Sep<br />
Month<br />
Figure 25. Regimes for Ebro River at <strong>Zaragoza</strong> under current conditions and projected<br />
conditions under Sc3 Scenario. Error bars represent standard deviations on a month basis (Source<br />
for current regime: CHE, 2007)<br />
In current conditions maximum discharges <strong>of</strong> nearly 400 m 3 s -1 are expected between<br />
December and April. Minimum discharges are expected during summer time,<br />
especially in August, where they can be as low as 30 m 3 s -1 . This also means that the<br />
impact <strong>of</strong> <strong>Zaragoza</strong> UWS upon the Ebro River is not constant all over the year and it<br />
reaches a maximum in August. Figure 26 provides an example <strong>of</strong> the seasonality <strong>of</strong><br />
this impact taking total phosphorus as an example.<br />
54