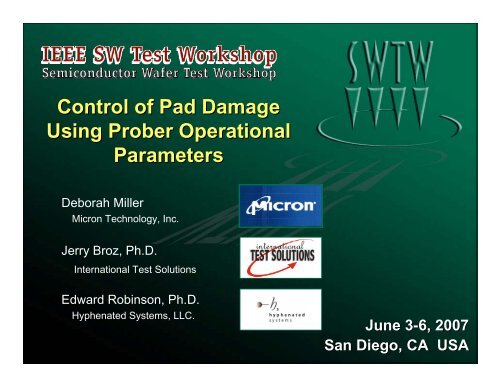
Control of Pad Damage Using Prober Operational Parameters
Control of Pad Damage Using Prober Operational Parameters
Control of Pad Damage Using Prober Operational Parameters

Create successful ePaper yourself
Turn your PDF publications into a flip-book with our unique Google optimized e-Paper software.
<strong>Control</strong> <strong>of</strong> <strong>Pad</strong> <strong>Damage</strong><br />
<strong>Using</strong> <strong>Prober</strong> <strong>Operational</strong><br />
<strong>Parameters</strong><br />
Deborah Miller<br />
Micron Technology, Inc.<br />
Jerry Broz, Ph.D.<br />
International Test Solutions<br />
Edward Robinson, Ph.D.<br />
Hyphenated Systems, LLC.<br />
June 3-6, 3<br />
2007<br />
San Diego, CA USA
Overview<br />
• Introduction / Background<br />
• Objectives<br />
• Materials and Methods<br />
• Results<br />
• Analysis / Discussion<br />
• Conclusions<br />
June 3-6, 3<br />
2007 IEEE SW Test Workshop 2
Introduction<br />
• Probe card technologies have become advanced; however, the<br />
basics <strong>of</strong> wafer sort really have not changed<br />
• ALL probe technologies have a contact area substantially<br />
harder than the pads or solder balls <strong>of</strong> the device<br />
• “Contact and slide” is CRITICAL to break surface oxide(s), but<br />
results in localized plastic deformation, i.e. a probe mark<br />
• Volume <strong>of</strong> material displaced and/or transferred is a complex<br />
function <strong>of</strong> dynamic contact mechanics, metallic interactions,<br />
frictional effects, and other tribological properties<br />
• Disclaimer: scrub mark photos, pad pr<strong>of</strong>iles, and pad structures shown<br />
in this presentation are not considered representative <strong>of</strong> or meant to<br />
infer anything about the process <strong>of</strong> record for Micron products.<br />
June 3-6, 3<br />
2007 IEEE SW Test Workshop 3
Background – Area Effects<br />
<strong>Pad</strong> damage due to probe has been positively correlated<br />
to bondability issues.<br />
– Reduced ball shear strength and wire pull strength<br />
– Increased NSOP (no stick on pad) and LBB (lifted ball bond)<br />
Assembly Parameter vs. Probe Mark Area<br />
Ball Shear (grams)<br />
Wire Pull (grams)<br />
Ball Shear<br />
Wire Pull<br />
Critical Value<br />
<strong>Damage</strong> = 25%<br />
% LBB<br />
% NSOP<br />
% AREA <strong>Pad</strong> <strong>Damage</strong><br />
% LBB Rejects<br />
% NSOP Rejects<br />
Sources …<br />
Tran, et al., ECTC -2000<br />
Tran, et al., SWTW-2000<br />
Langlois, et al, SWTW-2001<br />
Hotchkiss, et al., ECTC-2001<br />
Hothckiss, et al., IRPS-2001<br />
Among others …<br />
June 3-6, 3<br />
2007 IEEE SW Test Workshop 4
Area Effects Are Not Enough !<br />
Blanket aluminum wafer from IMSI SEMATECH<br />
A probe mark can have a<br />
relatively small area <strong>of</strong><br />
damage, but exceed the<br />
critical allowable depth.<br />
– % Area <strong>Damage</strong> = 8.8%<br />
which is within limits<br />
– Depth = 10000Å which is<br />
excessively deep<br />
6000 Å aluminum + 5500 Å thermal oxide = 11000 Å<br />
Probe Depth = 10000Å (punch-through)<br />
June 3-6, 3<br />
2007 IEEE SW Test Workshop 5
Background – Depth Effects<br />
Excessively deep probe marks can cause …<br />
– Underlying layer damage (low-k dielectric, circuitry under bond<br />
pads, and aluminum capped copper pads)<br />
– Bondability and long term reliability issues<br />
Many steps are<br />
needed to<br />
assess cracks.<br />
Images from Hartfield, et al, SWTW-2003<br />
Sources …<br />
Hartfield, et al, SWTW-2003<br />
Martens, et. al., SWTW-2003<br />
Hartfield, et al., SWTW-2004<br />
Stillman, et al., SWTW-2005<br />
Among others …<br />
June 3-6, 3<br />
2007 IEEE SW Test Workshop 6
Background – Height Effects<br />
<strong>Pad</strong> material pile-up has also been correlated to<br />
bondability issues.<br />
– Reduced ball shear strength and wire pull strength<br />
– Increased NSOP (no stick on pad) and LBB (lifted ball bond)<br />
Assembly Parameter vs. Aluminum Pile-Up<br />
Ball Shear (grams)<br />
Wire Pull (grams)<br />
Ball Shear<br />
Wire Pull<br />
Critical Value<br />
“unknown”<br />
% LBB<br />
% NSOP<br />
% LBB Rejects<br />
% NSOP Rejects<br />
Height <strong>of</strong> Pile - Up<br />
Sources …<br />
Langlois, et al, SWTW-2001<br />
Among others …<br />
June 3-6, 3<br />
2007 IEEE SW Test Workshop 7
<strong>Control</strong>ling the <strong>Damage</strong><br />
• The depth <strong>of</strong> the probe mark can be controlled with<br />
modifications to the probe card technology<br />
– Low force probe cards (various manufacturers)<br />
– Optimized probe to pad interactions<br />
• <strong>Prober</strong>s can effectively change the z-stage motion just<br />
before contact and during overtravel to reduce damage<br />
– Variable Speed Probing by Accretech ®<br />
– Micro-Touch by Electroglas ®<br />
– Micro-Force Probing by Tokyo Electron Limited ® (TEL)<br />
June 3-6, 3<br />
2007 IEEE SW Test Workshop 8
Assessing the <strong>Damage</strong><br />
Traditional depth, volume, and height measurements are<br />
time consuming and can have long cycle times.<br />
– Probing under different conditions<br />
– Wafers must be scrapped<br />
– Careful wafer sectioning<br />
– Sample preparation and de-processing<br />
– Electron-based microscopy<br />
Probe Card + Wafer<br />
• Touchdowns<br />
• Variable Conditions<br />
Manual Failure Analysis<br />
• Sectioning<br />
• Deprocessing<br />
• Electron Microscopy<br />
• Metrology / Correlation<br />
Reporting<br />
<strong>Damage</strong> Assessment<br />
Feedback to Production<br />
June 3-6, 3<br />
2007 IEEE SW Test Workshop 9
Probe Mark 3D Cross Section<br />
• From the wafer sort standpoint …<br />
Displaced volume can be correlated to key sort parameters, e.g. z-stage<br />
speed, overtravel, probe force, cracking, punch-through, etc.<br />
• From a cleaning standpoint …<br />
Displaced volume provides insight into accumulation rates and material<br />
adherence.<br />
PROBE MARK<br />
<strong>Pad</strong> surface<br />
-100nm<br />
-200nm<br />
-300nm<br />
-400nm<br />
-500nm<br />
June 3-6, 3<br />
2007 IEEE SW Test Workshop 10
Objectives<br />
• Develop a multi-variable parametric DoE to identify<br />
primary prober operational contributors to probe damage<br />
• Perform a statistically valid and practical failure analysis<br />
on damaged bond pads without cross-sectioning or deprocessing<br />
the wafers<br />
– 3D confocal, non-contact microscopy with a better than 50nm<br />
resolution<br />
– Wafers must be available for follow-on metrology<br />
• Identify an optimized combination <strong>of</strong> prober operational<br />
settings to reduce the overall area and volumetric probe<br />
damage, i.e. disturbed pad area<br />
Can reasonable steps be taken with existing technologies (e.g., an<br />
existing probe card and a prober) to reduce pad damage in a costeffective<br />
manner ?<br />
June 3-6, 3<br />
2007 IEEE SW Test Workshop 11
Factors (<strong>Prober</strong> <strong>Operational</strong> Settings)<br />
• Number <strong>of</strong> Touchdowns<br />
Single vs. Double<br />
• Overtravel Magnitude<br />
Low (50um) vs. Middle (63um) vs. High (75um)<br />
• Undertravel Magnitude<br />
Low (0um) vs. Middle (10um) vs. High (20um)<br />
• Pin-Update Execution<br />
– Abbreviated pin alignment to compensate for thermal movement<br />
– On vs. Off<br />
• Wafer Chuck Speed<br />
Low (6000 um/sec) vs. High (18000 um/sec)<br />
• Chuck Revise Execution<br />
– Re-zero <strong>of</strong> the wafer chuck to compensate for thermal movement<br />
– On vs. Off<br />
June 3-6, 3<br />
2007 IEEE SW Test Workshop 12
Responses (Probe Mark Features)<br />
• Probe Mark Depth<br />
• Pile-up Height<br />
• Probe Mark<br />
–Area<br />
–Volume<br />
• Pile-up<br />
–Area<br />
–Volume<br />
June 3-6, 3<br />
2007 IEEE SW Test Workshop 13
Design <strong>of</strong> Experiment (DoE(<br />
DoE)<br />
Touchdowns Undertravel Pin-Update Wafer Chuck Speed Chuck Revise Overtravel<br />
ID<br />
1 Single Off On High Off 63<br />
<strong>Control</strong><br />
20 Single 10 Off High On 50<br />
17 Single 20 On High On 50<br />
9 Single Off Off Low On 50<br />
21 Single 10 Off High Off 63<br />
13 Single 20 Off Low Off 63<br />
7 Single 10 On Low On 75<br />
12 Single 20 Off Low Off 75<br />
11 Single Off On Low Off 75<br />
15 Double 10 On Low Off 50<br />
14 Double 20 Off Low Off 50<br />
23 Double Off On High Off 50<br />
8 Double 10 On Low On 63<br />
19 Double 20 On High On 63<br />
10 Double Off Off Low On 63<br />
24 Double 10 Off High Off 75<br />
18 Double 20 On High On 75<br />
16 Double Off Off High On 75<br />
indicates a condition different than the CONTROL<br />
June 3-6, 3<br />
2007 IEEE SW Test Workshop 14
Materials and Methods<br />
June 3-6, 3<br />
2007 IEEE SW Test Workshop 15
Wafer Sort Tools<br />
• Cantilevered probe card<br />
Diagonal multi-site (X8) probe card representative <strong>of</strong><br />
production.<br />
• 25-wafer LOT<br />
<strong>Pad</strong> Lot wafer representative <strong>of</strong> pad metal layer.<br />
• Production Tester + <strong>Prober</strong> combination<br />
Test cell with a “known good” condition.<br />
• One operator<br />
Operator variability kept to a minimum.<br />
June 3-6, 3<br />
2007 IEEE SW Test Workshop 16
Probe Mark Inspection Layout<br />
Location A<br />
2<br />
Two sites <strong>of</strong> interest<br />
within each touchdown<br />
1<br />
Location B<br />
1<br />
2<br />
2<br />
Four pads <strong>of</strong><br />
interest in<br />
each site<br />
Location C<br />
1<br />
Three touchdowns<br />
across 200 mm wafer<br />
“Split Probe” marks were<br />
observed AND included<br />
in the dataset.<br />
June 3-6, 3<br />
2007 IEEE SW Test Workshop 17
Probe Mark Metrology<br />
• Scrub mark volume and area<br />
• Pile up volume and area<br />
• Maximum depth<br />
June 3-6, 3<br />
2007 IEEE SW Test Workshop 18
Scrub Mark Measurement<br />
Signal threshold reference level at the pad surface.<br />
Region <strong>of</strong><br />
Interest<br />
Threshold parameters set<br />
to determine the area<br />
falling more than 100nm<br />
beneath average pad level.<br />
June 3-6, 3<br />
2007 IEEE SW Test Workshop 19
Pile-up Measurement<br />
Signal threshold reference level at the pad surface.<br />
Region <strong>of</strong><br />
Interest<br />
Threshold parameters set<br />
to determine the area<br />
falling more than 200nm<br />
above average pad level.<br />
June 3-6, 3<br />
2007 IEEE SW Test Workshop 20
Depth Measurement<br />
A cross-section tool is used to measure the<br />
probe depth.<br />
June 3-6, 3<br />
2007 IEEE SW Test Workshop 21
Test Results<br />
June 3-6, 3<br />
2007 IEEE SW Test Workshop 22
<strong>Pad</strong> <strong>Damage</strong> Pareto<br />
350<br />
Sorted by <strong>Pad</strong> Volume <strong>Damage</strong><br />
microns 2<br />
300<br />
250<br />
200<br />
150<br />
100<br />
50<br />
microns 3<br />
0<br />
-50<br />
-100<br />
W16<br />
W18<br />
W24<br />
W10<br />
W08<br />
W19<br />
W14<br />
W23<br />
W15<br />
W12<br />
W07<br />
W11<br />
W21<br />
W22<br />
W13<br />
W01<br />
W09<br />
W20<br />
W17<br />
Area <strong>Damage</strong><br />
Volumetric <strong>Damage</strong><br />
June 3-6, 3<br />
2007 IEEE SW Test Workshop 23
Pile-up Pareto<br />
350<br />
Sorted by <strong>Pad</strong> Volume <strong>Damage</strong><br />
microns 2<br />
300<br />
250<br />
200<br />
150<br />
100<br />
50<br />
microns 3<br />
0<br />
-50<br />
-100<br />
W16<br />
W18<br />
W24<br />
W10<br />
W08<br />
W19<br />
W14<br />
W23<br />
W15<br />
W12<br />
W07<br />
W11<br />
W21<br />
W22<br />
W13<br />
W01<br />
W09<br />
W20<br />
W17<br />
Area <strong>Damage</strong><br />
Volumetric <strong>Damage</strong><br />
June 3-6, 3<br />
2007 IEEE SW Test Workshop 24
Maximum Scrub Volume<br />
One Way Analysis Variance <strong>of</strong> MAXIMUM Scrub Volume By Wafer<br />
Scrub Volume<br />
100<br />
90<br />
80<br />
70<br />
60<br />
50<br />
40<br />
30<br />
20<br />
10<br />
1 7 8 9 10 11 12 13 14 15 16 17 18 19 20 21 22 23 24<br />
Wafer<br />
Each Pair<br />
Student's t<br />
0.05<br />
W16<br />
W18<br />
W24<br />
Statistically<br />
Significant<br />
Max <strong>Damage</strong><br />
Touchdowns Undertravel Pin-Update Wafer Chuck Speed Chuck Revise Overtravel<br />
24 Double 10 Off High Off 75<br />
18 Double 20 On High On 75<br />
16 Double Off Off High On 75<br />
June 3-6, 3<br />
2007 IEEE SW Test Workshop 25
Minimum Scrub Volume<br />
One Way Analysis <strong>of</strong> Variance <strong>of</strong> MINIMUM Scrub Volume By Wafer<br />
Scrub Volume<br />
100<br />
90<br />
80<br />
70<br />
60<br />
50<br />
40<br />
30<br />
20<br />
10<br />
1 7 8 9 10 11 12 13 14 15 16 17 18 19 20 21 22 23 24<br />
Wafer<br />
Each Pair<br />
Student's t<br />
0.05<br />
Borderline<br />
Statistically<br />
Significant<br />
Min <strong>Damage</strong><br />
W09<br />
W17<br />
W20<br />
Touchdowns Undertravel Pin-Update Wafer Chuck Speed Chuck Revise Overtravel<br />
20 Single 10 Off High On 50<br />
17 Single 20 On High On 50<br />
9 Single Off Off Low On 50<br />
June 3-6, 3<br />
2007 IEEE SW Test Workshop 26
Maximum Scrub Area<br />
One way Analysis <strong>of</strong> MAXIMUM Scrub Area By Wafer<br />
350<br />
Scrub Area<br />
300<br />
250<br />
200<br />
150<br />
W024<br />
Statistically<br />
Significant<br />
Max <strong>Damage</strong><br />
100<br />
50<br />
1 7 8 9 10 11 12 13 14 15 16 17 18 19 20 21 22 23 24<br />
Wafer<br />
Each Pair<br />
Student's t<br />
0.05<br />
Touchdowns Undertravel Pin-Update Wafer Chuck Speed Chuck Revise Overtravel<br />
24 Double 10 Off High Off 75<br />
June 3-6, 3<br />
2007 IEEE SW Test Workshop 27
Minimum Scrub Area<br />
One Way Analysis <strong>of</strong> MINIMUM Scrub Area By Wafer<br />
350<br />
Scrub Area<br />
300<br />
250<br />
200<br />
150<br />
Borderline<br />
Statistically<br />
Significant<br />
Min <strong>Damage</strong><br />
W09<br />
100<br />
W17<br />
50<br />
1 7 8 9 10 11 12 13 14 15 16 17 18 19 20 21 22 23 24<br />
Wafer<br />
Each Pair<br />
Student's t<br />
0.05<br />
W20<br />
Touchdowns Undertravel Pin-Update Wafer Chuck Speed Chuck Revise Overtravel<br />
20 Single 10 Off High On 50<br />
17 Single 20 On High On 50<br />
9 Single Off Off Low On 50<br />
June 3-6, 3<br />
2007 IEEE SW Test Workshop 28
Analysis / Discussion<br />
June 3-6, 3<br />
2007 IEEE SW Test Workshop 29
Scrub Mark Data Modeled in JMP<br />
Scrub Mark Data Modeled in JMP<br />
Actual vs. Predicted Results<br />
Response Mean (Scrub Volume)<br />
Actual by Predicted Plot<br />
Mean(Scrub<br />
Volume) Actual<br />
80<br />
70<br />
60<br />
50<br />
40<br />
30<br />
20<br />
10<br />
10 20 30 40 50 60 70 80<br />
Mean(Scrub Volume) Predicted<br />
P
Significant Factor Estimates<br />
Probe Mark Volume<br />
Primary Responses<br />
td[Double]<br />
ot[50]<br />
13.3180<br />
-12.4100<br />
Single vs. Double Touchdown<br />
Minimum vs. Maximum Overtravel<br />
speed[Low]*ot[63]<br />
ot[63]<br />
speed[Low]*ot[50]<br />
speed[Low]<br />
pu[Off]<br />
speed[Low]*cr[Off]<br />
cr[Off]<br />
ut[10]<br />
ut[20]<br />
2.0472<br />
-1.9320<br />
1.6657<br />
-1.1663<br />
1.0323<br />
-0.9465<br />
-0.7554<br />
-0.6623<br />
-0.0079<br />
Secondary Responses<br />
No clear wafer chuck speed<br />
dependency was surprising.<br />
0 2 4 6 8 10 12 14 16<br />
Scaled Estimates<br />
June 3-6, 3<br />
2007 IEEE SW Test Workshop 31
Significant Factor Estimates<br />
Probe Mark Area<br />
Primary Responses<br />
td[Double]<br />
ot[50]<br />
39.9630<br />
-38.75266<br />
Single vs. Double Touchdown<br />
Minimum vs. Maximum Overtravel<br />
speed[Low]<br />
ot[63]<br />
speed[Low]*ot[50]<br />
speed[Low]*ot[63]<br />
speed[Low]*cr[Off]<br />
pu[Off]<br />
cr[Off]<br />
ut[20]<br />
ut[10]<br />
-9.0581<br />
-7.1279<br />
5.4209<br />
5.0350<br />
-4.8920<br />
2.7873<br />
2.0336<br />
1.6605<br />
-1.5891<br />
Secondary Responses<br />
A reduced dataset analysis<br />
showed that speed was the<br />
third largest factor<br />
contributing to the<br />
probe mark area response.<br />
0 5 10 15 20 25 30 35 40 45<br />
Scaled Estimates<br />
June 3-6, 3<br />
2007 IEEE SW Test Workshop 32
Correlation Between Responses<br />
Scatterplot Matrix<br />
80<br />
Mean(Scrub<br />
70<br />
Volume)<br />
60<br />
50<br />
40<br />
30<br />
td<br />
Double<br />
Single<br />
• As expected, the probe mark<br />
scrub area and scrub volume<br />
showed statistically high<br />
correlations to each other<br />
20<br />
300<br />
250<br />
200<br />
150<br />
Mean(Scrub<br />
Area)<br />
• The correlation between<br />
probe mark depth and<br />
volume was not statistically<br />
significant<br />
100<br />
0.5<br />
0.45<br />
0.4<br />
20 30 40 50 60 70 80<br />
100 150 200 250 300<br />
Mean(Scrub<br />
Depth)<br />
.4 .45 .5<br />
• Possible reasons for lack <strong>of</strong><br />
correlation to probe depth<br />
– Small sample size effects<br />
– Operator-induced variability<br />
– Probe tip diameter<br />
– Probe gram force<br />
June 3-6, 3<br />
2007 IEEE SW Test Workshop 33
Pile-up Data Modeled in JMP<br />
Actual vs. Predicted Results<br />
Response Mean (Pile Up Volume)<br />
Response Mean (Pile Up Area)<br />
Actual by Predicted Plot<br />
Actual by Predicted Plot<br />
60<br />
120<br />
Mean(Divot<br />
Volume) Actual<br />
50<br />
40<br />
30<br />
20<br />
10<br />
Mean(Divot<br />
Area) Actual<br />
100<br />
80<br />
60<br />
40<br />
0<br />
0 10 20 30 40 50 60<br />
Mean(Divot Volume) Predicted<br />
P=0.0012 RSq=0.95 RMSE=4.6836<br />
20<br />
20 40 60 80 100 120<br />
Mean(Divot Area) Predicted<br />
P=0.0009 RSq=0.96 RMSE=8.0552<br />
Summary <strong>of</strong> Fit<br />
RSquare 0.954192<br />
RSquare Adj 0.882209<br />
Root Mean Square Error 4.683565<br />
Mean <strong>of</strong> Response 26.51567<br />
Observations (or Sum Wgts) 19<br />
Summary <strong>of</strong> Fit<br />
RSquare 0.957954<br />
RSquare Adj 0.891882<br />
Root Mean Square Error 8.055216<br />
Mean <strong>of</strong> Response 62.74199<br />
Observations (or Sum Wgts) 19<br />
June 3-6, 3<br />
2007 IEEE SW Test Workshop 34
Significant Factor Estimates<br />
Pile-up Volume<br />
Primary Responses<br />
td[Double]<br />
ot[50]<br />
13.3180<br />
-12.4100<br />
Single vs. Double Touchdown<br />
Minimum vs. Maximum Overtravel<br />
speed[Low]*ot[63]<br />
ot[63]<br />
speed[Low]*ot[50]<br />
speed[Low]<br />
pu[Off]<br />
speed[Low]*cr[Off]<br />
cr[Off]<br />
ut[10]<br />
ut[20]<br />
2.0472<br />
-1.9320<br />
1.6657<br />
-1.1663<br />
1.0323<br />
-0.9465<br />
-0.7554<br />
-0.6623<br />
-0.0079<br />
Secondary Responses<br />
Additional dataset analysis<br />
showed that speed was<br />
a contributing factor for<br />
pile-up volume<br />
0 2 4 6 8 10 12 14 16<br />
Scaled Estimates<br />
June 3-6, 3<br />
2007 IEEE SW Test Workshop 35
Significant Factor Estimates<br />
Pile Up Area<br />
Primary Responses<br />
td[Double]<br />
ot[50]<br />
-11.6636<br />
20.6415<br />
Single vs. Double Touchdown<br />
Minimum vs. Maximum Overtravel<br />
ut[20]<br />
speed[Low]*cr[Off]<br />
speed[Low]<br />
pu[Off]<br />
cr[Off]<br />
ut[10]<br />
ot[63]<br />
speed[Low]*ot[63]<br />
speed[Low]*ot[50]<br />
-4.4643<br />
2.5774<br />
1.9346<br />
1.9195<br />
1.8716<br />
1.5082<br />
-1.4899<br />
1.3116<br />
-0.4748<br />
Secondary Responses<br />
No clear wafer chuck speed<br />
dependency was surprising.<br />
Undertravel was a more significant<br />
contributing factor than chuck<br />
speed.<br />
0 5 10 15 20 25<br />
Scaled Estimates<br />
June 3-6, 3<br />
2007 IEEE SW Test Workshop 36
Correlation Between Responses<br />
Scatterplot Matrix<br />
70<br />
50<br />
30<br />
20<br />
300<br />
250<br />
Mean(Scrub<br />
Volume)<br />
• Statistically significant<br />
correlation between the<br />
primary responses (area<br />
and volume) was<br />
observed.<br />
200<br />
150<br />
100<br />
60<br />
50<br />
40<br />
30<br />
20<br />
10<br />
Mean(Scrub<br />
Area)<br />
Mean(Divot<br />
Volume)<br />
• Modeled data can be<br />
used to investigate<br />
optimal conditions.<br />
120<br />
100<br />
80<br />
60<br />
40<br />
Mean(Divot<br />
Area)<br />
20 30 40 50 60 70 80<br />
100 150 200 250 300<br />
10 20 30 40 50 60<br />
40 60 80 100 120<br />
June 3-6, 3<br />
2007 IEEE SW Test Workshop 37
Best Case Combinations<br />
• Modeled response data can be used to investigate the effects <strong>of</strong><br />
changing one parameter and keeping the other constant.<br />
– Slopes <strong>of</strong> the lines can give some indication <strong>of</strong> sensitivity to the change.<br />
Mean(Divot<br />
Volume)<br />
8.732232<br />
±8.432413<br />
60<br />
40<br />
20<br />
0<br />
Double<br />
Single<br />
td<br />
Single<br />
Low<br />
Hig h<br />
speed<br />
High<br />
Off<br />
Off On<br />
cr<br />
On<br />
50<br />
63<br />
50<br />
ot<br />
75<br />
10<br />
20<br />
20<br />
ut<br />
<strong>of</strong>f<br />
Off<br />
On<br />
pu<br />
On<br />
Mean(Scrub<br />
Area)<br />
64.05595<br />
±19.72275<br />
300<br />
250<br />
200<br />
150<br />
100<br />
50<br />
Double<br />
Single<br />
Low<br />
High<br />
Off<br />
On<br />
50<br />
63<br />
75<br />
10<br />
20<br />
<strong>of</strong>f<br />
Off<br />
On<br />
Single<br />
Low<br />
Off<br />
50<br />
10<br />
On<br />
td<br />
speed<br />
cr<br />
ot<br />
ut<br />
pu<br />
June 3-6, 3<br />
2007 IEEE SW Test Workshop 38
Summary / Conclusions<br />
• Reasonable steps can be taken with “existing” hardware to<br />
reduce pad damage in a cost-effective manner.<br />
• Volumetric probe damage assessment can be used to<br />
optimize probe/pad interaction and reduce yield fallout.<br />
– Non-contact methods are critical for statistically valid and practical failure<br />
analysis without de-processing and/or cross-sectioning.<br />
• Even with the small sample size, the statistical power was<br />
adequate to give an indication for response sensitivity to<br />
primary process factors.<br />
• The influence <strong>of</strong> second order factors for fine-tuning the<br />
operational parameters can be performed using modeled<br />
response data.<br />
June 3-6, 3<br />
2007 IEEE SW Test Workshop 39
Follow-On Work<br />
• Investigate improved height and depth measurements<br />
– Larger sample size<br />
– Improved automated methods to reduce operator induced<br />
variability<br />
• Consider probe card parameters<br />
– Probe tip diameter<br />
– Probe gram force<br />
• Validate test results using a secondary metrology<br />
evaluation<br />
• Further assessment <strong>of</strong> the “optimized” operational<br />
parameter combination<br />
– CRES performance evaluation<br />
– Bondability testing<br />
June 3-6, 3<br />
2007 IEEE SW Test Workshop 40
Acknowledgements<br />
• Chuck Jensen, Micron Technology, Inc.<br />
• Brett Crump, Micron Technology, Inc.<br />
• John Little, Hyphenated Systems, LLC<br />
June 3-6, 3<br />
2007 IEEE SW Test Workshop 41