2012 TPSEA Annual Report - Serena Hotels
2012 TPSEA Annual Report - Serena Hotels
2012 TPSEA Annual Report - Serena Hotels

Create successful ePaper yourself
Turn your PDF publications into a flip-book with our unique Google optimized e-Paper software.
Notes to the Financial Statements (continued)<br />
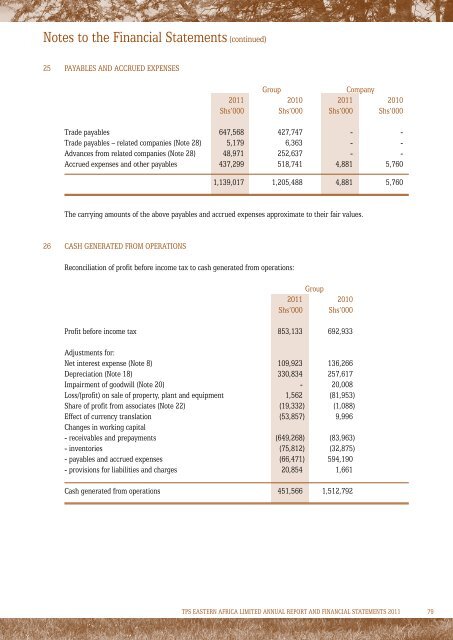
25 Payables and accrued expenses<br />
Group<br />
Company<br />
2011 2010 2011 2010<br />
Shs’000 Shs’000 Shs’000 Shs’000<br />
Trade payables 647,568 427,747 - -<br />
Trade payables – related companies (Note 28) 5,179 6,363 - -<br />
Advances from related companies (Note 28) 48,971 252,637 - -<br />
Accrued expenses and other payables 437,299 518,741 4,881 5,760<br />
1,139,017 1,205,488 4,881 5,760<br />
The carrying amounts of the above payables and accrued expenses approximate to their fair values.<br />
26 Cash generated from operations<br />
Reconciliation of profit before income tax to cash generated from operations:<br />
Group<br />
2011 2010<br />
Shs’000 Shs’000<br />
Profit before income tax 853,133 692,933<br />
Adjustments for:<br />
Net interest expense (Note 8) 109,923 136,266<br />
Depreciation (Note 18) 330,834 257,617<br />
Impairment of goodwill (Note 20) - 20,008<br />
Loss/(profit) on sale of property, plant and equipment 1,562 (81,953)<br />
Share of profit from associates (Note 22) (19,332) (1,088)<br />
Effect of currency translation (53,857) 9,996<br />
Changes in working capital<br />
- receivables and prepayments (649,268) (83,963)<br />
- inventories (75,812) (32,875)<br />
- payables and accrued expenses (66,471) 594,190<br />
- provisions for liabilities and charges 20,854 1,661<br />
Cash generated from operations 451,566 1,512,792<br />
TPS EASTERN AFRICA LIMITED ANNUAL REPORT AND FINANCIAL STATEMENTS 2011 79