

Auckland City Centre Rail Link - Business Case Review - Ministry of ...
Auckland City Centre Rail Link - Business Case Review - Ministry of ...
Auckland City Centre Rail Link - Business Case Review - Ministry of ...

Create successful ePaper yourself
Turn your PDF publications into a flip-book with our unique Google optimized e-Paper software.
<strong>Auckland</strong> <strong>City</strong> <strong>Centre</strong> <strong>Rail</strong> <strong>Link</strong> <strong>Business</strong> <strong>Case</strong> <strong>Review</strong> | May 2011<br />
Appendix A: Background<br />
1.1 <strong>Review</strong> purpose<br />
Following receipt <strong>of</strong> the <strong>Business</strong> <strong>Case</strong> on 19 November 2010 the Minister <strong>of</strong><br />
Transport asked the <strong>Ministry</strong> <strong>of</strong> Transport to lead a review <strong>of</strong> the <strong>Business</strong> <strong>Case</strong> with<br />
the Treasury. The Minister agreed that the <strong>Ministry</strong> <strong>of</strong> Transport should convene a<br />
working group comprising the Treasury, the NZ Transport Agency (NZTA), Kiwi<strong>Rail</strong>,<br />
<strong>Auckland</strong> Council and <strong>Auckland</strong> Transport. The <strong>Ministry</strong> <strong>of</strong> Transport and the<br />
Treasury were also asked to provide advice to ministers on the merits <strong>of</strong> the <strong>City</strong><br />
<strong>Centre</strong> <strong>Rail</strong> <strong>Link</strong> (CCRL) as a transport and economic investment and when the<br />
project might be required. Consultants provided technical expertise in specific areas<br />
<strong>of</strong> the review.<br />
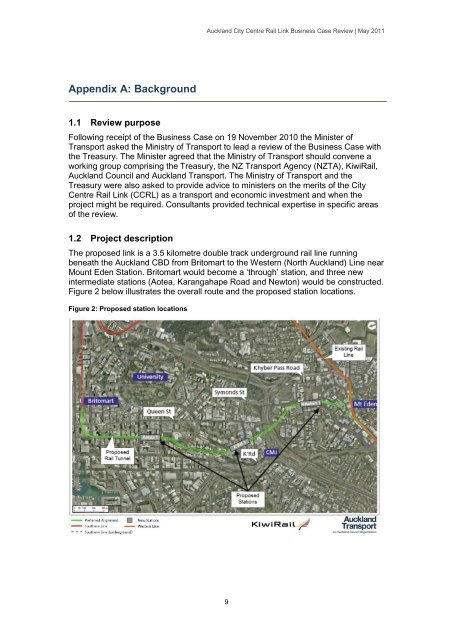
1.2 Project description<br />
The proposed link is a 3.5 kilometre double track underground rail line running<br />
beneath the <strong>Auckland</strong> CBD from Britomart to the Western (North <strong>Auckland</strong>) Line near<br />
Mount Eden Station. Britomart would become a ‗through‘ station, and three new<br />
intermediate stations (Aotea, Karangahape Road and Newton) would be constructed.<br />
Figure 2 below illustrates the overall route and the proposed station locations.<br />
Figure 2: Proposed station locations<br />
9
<strong>Auckland</strong> <strong>City</strong> <strong>Centre</strong> <strong>Rail</strong> <strong>Link</strong> <strong>Business</strong> <strong>Case</strong> <strong>Review</strong> | May 2011<br />
1.3 Purpose, origins and scope <strong>of</strong> the <strong>Business</strong> <strong>Case</strong><br />
Given existing congestion around the CBD and expectations <strong>of</strong> increased activity and<br />
employment within the CBD, the <strong>Business</strong> <strong>Case</strong> examined the benefits the project<br />
would provide by increasing passenger rail access to the CBD. The project is seen<br />
by <strong>Auckland</strong> Council as an important component <strong>of</strong> a package <strong>of</strong> measures required<br />
to support and promote growth in the productivity <strong>of</strong> the CBD and its social amenity,<br />
and as such to contribute to <strong>Auckland</strong>‘s growth as a whole.<br />
The background to the <strong>Business</strong> <strong>Case</strong> is important to understanding its timing and<br />
content.<br />
On 1 May 2008 the Minister <strong>of</strong> Finance under the previous government, wrote to the<br />
chair <strong>of</strong> NZ <strong>Rail</strong>ways Corporation (now part <strong>of</strong> Kiwi<strong>Rail</strong>) stating:<br />
“In my view it is in the long term public interest to secure and protect the CBD<br />
tunnel route, even though construction may not take place for many years...it is<br />
appropriate for ONTRACK to assist in the protection <strong>of</strong> the CBD tunnel route by<br />
acting to protect the route at the earliest appropriate opportunity”.<br />
This request was a response to the former <strong>Auckland</strong> <strong>City</strong> Council‘s granting <strong>of</strong> a nonnotified<br />
consent for a property development which could have compromised the<br />
future construction <strong>of</strong> the proposed tunnel. The route has no formal designation<br />
although it is mentioned in a range <strong>of</strong> planning documents.<br />
In June 2009, following an open procurement process between the <strong>Auckland</strong><br />
Regional Transport Authority (ARTA) and Kiwi<strong>Rail</strong>, Kiwi<strong>Rail</strong> gave approval for a<br />
contract to be signed with a consortium <strong>of</strong> Aecom, Parsons Brinckerh<strong>of</strong>f and Beca<br />
(APB&B) for the investigation and design <strong>of</strong> the CCRL. Kiwi<strong>Rail</strong> and ARTA shared<br />
the costs <strong>of</strong> the <strong>Business</strong> <strong>Case</strong> and the NZTA provided a 60 percent subsidy for<br />
ARTA‘s share <strong>of</strong> costs. The objective <strong>of</strong> the study was to ―produce Notice <strong>of</strong><br />
Requirement documentation <strong>of</strong> a quality sufficient to support designation <strong>of</strong> the<br />
route‖.<br />
Assessment <strong>of</strong> various CCRL route options and the number and locations <strong>of</strong> stations<br />
was undertaken from August 2009 to February 2010, when the preferred option was<br />
approved by ARTA and Kiwi<strong>Rail</strong> and endorsed by the former <strong>Auckland</strong> Regional<br />
Council, the <strong>Auckland</strong> <strong>City</strong> Council and the <strong>Auckland</strong> Regional Transport Committee.<br />
Subsequently in July 2010, following an initial business case stakeholder workshop 3<br />
in May, APB&B‘s brief for the <strong>Business</strong> <strong>Case</strong> was extended to undertake a review <strong>of</strong><br />
the CBD demographic trends and associated transport demands over the next 30<br />
years, together with an assessment <strong>of</strong> possible options for meeting these demands.<br />
The evolution and timing <strong>of</strong> the <strong>Business</strong> <strong>Case</strong>‘s development has meant that it does<br />
not contain some core elements set out in the NZTA‘s Economic Evaluation Manual<br />
(EEM) and the Treasury‘s <strong>Business</strong> <strong>Case</strong> guidelines (see www.infrastructure.govt.nz/<br />
publications/betterbusinesscases), which are requirements that need to be<br />
addressed before funding can be considered by the government. These most notably<br />
relate to the lack <strong>of</strong> a broad problem definition (the whole transport challenge facing<br />
the CBD) and the consequential full investigation <strong>of</strong> alternatives. This is not an area<br />
<strong>of</strong> disagreement between central government agencies and <strong>Auckland</strong> Council and<br />
<strong>Auckland</strong> Transport but reflects the changing pattern <strong>of</strong> expectations <strong>of</strong> this work<br />
3 The workshop was attended by representatives <strong>of</strong> the Treasury, the <strong>Ministry</strong> <strong>of</strong> Transport, and the NZTA as well as<br />
the former <strong>Auckland</strong> Regional and <strong>Auckland</strong> <strong>City</strong> Councils,<br />
10
<strong>Auckland</strong> <strong>City</strong> <strong>Centre</strong> <strong>Rail</strong> <strong>Link</strong> <strong>Business</strong> <strong>Case</strong> <strong>Review</strong> | May 2011<br />
through the last 3 years. <strong>Auckland</strong> Transport advises that the level <strong>of</strong> assessment <strong>of</strong><br />
alternatives has been sufficient for Notice <strong>of</strong> Requirement under the Resource<br />
Management Act 1991.<br />
1.4 <strong>Review</strong> process and methodology<br />
The <strong>Review</strong> process involved a working group <strong>of</strong> the <strong>Ministry</strong> <strong>of</strong> Transport, the<br />
Treasury, the NZTA, Kiwi<strong>Rail</strong>, <strong>Auckland</strong> Council and <strong>Auckland</strong> Transport. The<br />
process was collaborative but it is important to acknowledge different views between<br />
central government <strong>of</strong>ficials and <strong>Auckland</strong> Council and <strong>Auckland</strong> Transport on key<br />
aspects <strong>of</strong> the transport and wider economic benefits analysis.<br />
The terms <strong>of</strong> reference for the <strong>Review</strong> explicitly ruled out any investigation <strong>of</strong> funding<br />
and financing issues, and procurement approaches.<br />
The <strong>Review</strong> was undertaken through nine workstreams focusing on different areas <strong>of</strong><br />
the <strong>Business</strong> <strong>Case</strong>. For consistency, each workstream used the same assumptions<br />
including; the post-electrified metro rail network for the do minimum, the rail service<br />
pattern and rolling stock assumptions in the <strong>Business</strong> <strong>Case</strong> for the do something, the<br />
modelling tools set out in section 1.4.1.<br />
1.4.1 <strong>Auckland</strong> modelling tools<br />
Three models were used in developing the <strong>Business</strong> <strong>Case</strong> and undertaking this<br />
<strong>Review</strong>.<br />
The <strong>Auckland</strong> Public Transport (APT) model provides detailed forecasts <strong>of</strong> public<br />
transport patronage and associated benefits for the <strong>Auckland</strong> region. APT was<br />
used as the basis for rail patronage forecasts and transport benefit estimates.<br />
The ART3 model is a strategic transport model that provides forecasts <strong>of</strong> travel for<br />
all modes across the <strong>Auckland</strong> region. This model provides input to the APT<br />
model. ART3 model results were used as a basis for assessing the wider<br />
economic benefits.<br />
The <strong>Auckland</strong> Strategic Planning model (ASP) is the <strong>Auckland</strong> region‘s integrated<br />
transport and land use modelling system (which includes the ART3 model). This<br />
was run to assess the employment location changes arising from the project.<br />
The main model used, the APT model, was designed to help assess public transport<br />
projects like the CCRL. Both the APT model and the ART models have been<br />
calibrated for <strong>Auckland</strong> congestion conditions and used as inputs for other project<br />
assessments. The numbers presented in this report are therefore sufficient to provide<br />
orders <strong>of</strong> magnitude results on how the project will perform. Nevertheless, it is clear<br />
that a purpose-built model would be needed for more detailed analysis <strong>of</strong> CBD trips,<br />
particularly <strong>of</strong> congestion effects, and to take the project beyond the <strong>Business</strong> <strong>Case</strong><br />
and this <strong>Review</strong>.<br />
The <strong>Review</strong> compared the likely impacts <strong>of</strong> the do-minimum (the post-electrification<br />
network) with changes attributed specifically to the CCRL. The do-minimum includes<br />
allowances for the future impacts <strong>of</strong> proposed transport projects in the 2010<br />
<strong>Auckland</strong> Regional Land Transport Strategy (ARLTS), excluding only the future major<br />
rail projects.<br />
11
<strong>Auckland</strong> <strong>City</strong> <strong>Centre</strong> <strong>Rail</strong> <strong>Link</strong> <strong>Business</strong> <strong>Case</strong> <strong>Review</strong> | May 2011<br />
1.5 Strategic fit<br />
<strong>Auckland</strong> Council and <strong>Auckland</strong> Transport consider completing the CCRL by 2021 is<br />
critical to address constraints in the rail, bus and road networks within the <strong>Auckland</strong><br />
CBD and achieve <strong>Auckland</strong>‘s aspirations for a stronger CBD with significant<br />
employment, residential and tertiary student growth.<br />
While the <strong>Review</strong> has primarily assessed the project‘s effectiveness and economic<br />
efficiency, it is also important to consider the ‗strategic fit‘ <strong>of</strong> the CCRL. Strategic fit is<br />
one <strong>of</strong> the three main criteria used by the NZTA to assess and rank transport<br />
projects, along with effectiveness and efficiency. The CCRL will contribute to two<br />
aspects <strong>of</strong> the NZTA‘s strategic fit criteria: it helps reduce congestion in a major<br />
urban area, and it would help to strengthen and optimise operation <strong>of</strong> the rail<br />
network.<br />
The NZTA assessed the project against its low/medium/high strategic fit criterion and<br />
considers that the project has a ‗medium‘ pr<strong>of</strong>ile. The NZTA considers this could<br />
change to ‗high‘ once it is clear how the project fits with the <strong>Auckland</strong> spatial plan and<br />
if more evidence could be provided on land use integration, how the project will<br />
attract new patronage, reduce congestion and better integrate with buses and ferries.<br />
12
<strong>Auckland</strong> <strong>City</strong> <strong>Centre</strong> <strong>Rail</strong> <strong>Link</strong> <strong>Business</strong> <strong>Case</strong> <strong>Review</strong> | May 2011<br />
Appendix B: Project costs<br />
1.1 Capital costs <strong>of</strong> the <strong>City</strong> <strong>Centre</strong> <strong>Rail</strong> <strong>Link</strong><br />
Costs for the twin 3.5 kilometre tunnels (including stations, property purchase and<br />
contingencies) were reviewed using external experts. While a range <strong>of</strong> issues were<br />
identified and discussed, the <strong>Review</strong> concluded that the initial cost estimates and the<br />
anticipated time for completion, over a 10 year timeframe, were realistic.<br />
The NZ Transport Agency (NZTA) and external consultants peer reviewed the capital<br />
costs. The conclusion was that there was more scope for cost reduction than<br />
escalation in the project. Undertaking considerably more investigation <strong>of</strong> the subsurface<br />
along the route at an early stage was recommended, as this has been<br />
identified as a risk in the investigation phase. A sensitivity test for cost escalation was<br />
included in this review, reflecting international experience with cost growth in large<br />
infrastructure projects 4 (see Appendix G).<br />
The tunnelling work was regarded as relatively mainstream industry practice although<br />
the <strong>Review</strong> made several suggestions to potentially reduce costs and risks, notably<br />
the use <strong>of</strong> competitive early contractor involvement.<br />
1.2 Other rail network infrastructure capital costs<br />
Additional rail network infrastructure is needed to support the expansion <strong>of</strong> the <strong>City</strong><br />
<strong>Centre</strong> <strong>Rail</strong> <strong>Link</strong> (CCRL) services: additional train car sets, grade separation, other<br />
station upgrades and depot facilities and possibly signalling improvements.<br />
The <strong>Review</strong>, based primarily on the knowledge <strong>of</strong> Kiwi<strong>Rail</strong> and <strong>Auckland</strong> Transport<br />
staff in <strong>Auckland</strong>‘s current rail upgrade and network electrification programmes,<br />
identified total additional costs <strong>of</strong> $155–165 million, plus an amount yet to be<br />
confirmed, if required, for additional signalling. This added some $20–30 million to<br />
the estimate in the <strong>Business</strong> <strong>Case</strong> after removing items assumed to be funded from<br />
alternative sources.<br />
1.3 Operating costs<br />
Under the <strong>Business</strong> <strong>Case</strong> assumptions the project would be operational from 2021,<br />
resulting in extra operating costs from running more trains, with a further increase in<br />
services from 2030. These include train operating and maintenance costs, track and<br />
tunnel maintenance, and station operating costs.<br />
The <strong>Review</strong> incorporated the most recent data on operating costs <strong>of</strong> the metro<br />
network into a financial model agreed between the <strong>Ministry</strong> <strong>of</strong> Transport and<br />
<strong>Auckland</strong> Transport. These results were compared with the predicted operating costs<br />
in the <strong>Business</strong> <strong>Case</strong>, which were based on data provided by the <strong>Auckland</strong> Regional<br />
Transport Authority in May 2010.<br />
The <strong>Review</strong> estimated that operational costs from 2021 would be $8.9 million per<br />
annum (pa) higher than the <strong>Business</strong> <strong>Case</strong> (in total an $18.1 million pa increase on<br />
4 in Flyvbjerg, B: ―From Nobel Prize to project management: Getting Risks right”, August 2006 Project Management<br />
Journal<br />
13
<strong>Auckland</strong> <strong>City</strong> <strong>Centre</strong> <strong>Rail</strong> <strong>Link</strong> <strong>Business</strong> <strong>Case</strong> <strong>Review</strong> | May 2011<br />
current operating costs), and $17.5 million pa above those in the <strong>Business</strong> <strong>Case</strong> from<br />
2030 (in total an increase <strong>of</strong> $36.8 million pa).<br />
Table 2: <strong>Business</strong> <strong>Case</strong> and <strong>Review</strong> cost comparison<br />
All estimates in 2010 dollars<br />
<strong>Business</strong> <strong>Case</strong><br />
($ million)<br />
<strong>Review</strong><br />
($ million)<br />
CCRL construction costs (expected estimate) 1,991 1,991<br />
Additional rolling stock required at opening 240 240<br />
Other rail infrastructure costs 100 120-130<br />
Total capital costs at opening 2,331 2,351-2,361<br />
Operating costs additional to the do minimum<br />
9.2 pa from 2021<br />
19.3 pa from 2030<br />
18.1 pa from 2021<br />
36.8 pa from 2030<br />
Further rolling stock required in 2030 260 260<br />
Total net present value <strong>of</strong> costs 1,580 1,699<br />
1.4 Construction impacts<br />
Construction <strong>of</strong> the CCRL will involve disruption at a range <strong>of</strong> sites, some for several<br />
years. Details are set out in the table below. Direct costs for traffic management have<br />
generally been included but the impact on traffic and associated disbenefits <strong>of</strong><br />
construction have not been estimated.<br />
The restrictions on Albert Street and Symonds Street in particular will affect public<br />
transport. The restrictions on what is called lower Albert Street (but includes Customs<br />
Street east – which takes bus traffic from the North Shore <strong>of</strong>f Fanshawe Street) are<br />
likely to have significant vehicle traffic implications.<br />
Table 3: Indicative road restrictions and closures 5<br />
Area<br />
Albert Street (and parts <strong>of</strong> Wellesley Street and Victoria<br />
Street) restricted to two lanes (to build Aotea Station)<br />
Mt Eden Bridge restricted to two lanes (to rebuild<br />
bridge with a greater span)<br />
Symonds Street restricted to two lanes (to build<br />
Newton Station)<br />
Lower Albert Street restricted to two lanes (to build cut<br />
and cover section <strong>of</strong> tunnel)<br />
Porters Avenue shut (to divert NAL and construct road<br />
overbridge)<br />
Lower Queen Street restricted to one lane (to build cut<br />
and cover section <strong>of</strong> tunnel)<br />
Normanby Road shut (to construct road overbridge)<br />
Project<br />
Start Date<br />
(month)<br />
Project<br />
Finish Date<br />
(month)<br />
Duration<br />
(months)<br />
6 44 39<br />
11 23 13<br />
13 30 19<br />
13 27 15<br />
27 40 14<br />
27 33 7<br />
36 38 3<br />
In addition, part <strong>of</strong> Beresford Square (including the give way turn onto Pitt Street) will be permanently<br />
closed to enable construction and operation <strong>of</strong> K Road station. The actual and potential traffic effects<br />
have been discussed in section 7.4 <strong>of</strong> the AEE, including methods to mitigate and manage the effects<br />
<strong>of</strong> construction traffic<br />
5 Taken from the assessment <strong>of</strong> environmental effects prepared by APB&B.<br />
14
<strong>Auckland</strong> <strong>City</strong> <strong>Centre</strong> <strong>Rail</strong> <strong>Link</strong> <strong>Business</strong> <strong>Case</strong> <strong>Review</strong> | May 2011<br />
Appendix C: Patronage and effectiveness<br />
This appendix outlines the <strong>Review</strong>‘s assessment <strong>of</strong> the changes in travel patterns<br />
expected as a result <strong>of</strong> the <strong>City</strong> <strong>Centre</strong> <strong>Rail</strong> <strong>Link</strong> (CCRL) and the effectiveness <strong>of</strong> the<br />
project in providing capacity for travel into the CBD. It also discusses issues with the<br />
reliability <strong>of</strong> the rail network and the findings relating to the assessment <strong>of</strong><br />
alternatives.<br />
1.1 Context<br />
Public transport trips into the CBD have increased by over 50 percent over the past<br />
10 years, with growth in rail patronage accounting for 40 percent <strong>of</strong> the increase.<br />
There has also been an approximate 15 percent decline in car trips into the CBD in<br />
the past decade.<br />
These trends have resulted in a 48 percent CBD morning peak modal share for<br />
public transport compared with 52 percent for cars (<strong>Auckland</strong> Regional Council<br />
cordon count 2010).<br />
The growth in public transport use can be attributed to a range <strong>of</strong> factors but it seems<br />
clear that much <strong>of</strong> the growth in trips has come from the Rapid Transit Network<br />
(RTN) which is comprised <strong>of</strong> the Northern Busway and the rail network. The<br />
significant investment in these RTN elements has been key. The Busway has<br />
accounted for 33 percent <strong>of</strong> new trips, while rail has accounted for 40 percent, with<br />
the remainder coming from other bus and ferry operations. Figure 3 compares the<br />
key sources <strong>of</strong> public transport trips into the CBD between 2001 and 2010.<br />
Figure 3: Increase in public transport trips by type (morning peak)<br />
Annual rail patronage growth has been strong since the opening <strong>of</strong> Britomart in 2003,<br />
although this has occurred from a low base. Annual trips across the network reached<br />
9.2 million for the 12 months to the end <strong>of</strong> February 2011, nearly four times the 2.5<br />
million trips on the network in 2003.<br />
15
<strong>Auckland</strong> <strong>City</strong> <strong>Centre</strong> <strong>Rail</strong> <strong>Link</strong> <strong>Business</strong> <strong>Case</strong> <strong>Review</strong> | May 2011<br />
Growth in morning peak rail patronage has also been strong. In 2010, morning peak<br />
patronage was around 9,500, which is more than two and a half times the figure <strong>of</strong><br />
3,751, in 2003.<br />
Investment to electrify and upgrade the rail network is expected to have a significant<br />
effect on patronage. The modelling forecasts used as a base case for this review<br />
suggest annual patronage <strong>of</strong> 21 million in 2016 (or 19,000 trips in the morning peak)<br />
without the CCRL. Meeting these modelled forecasts will require a doubling <strong>of</strong><br />
patronage from 2010 levels, which may be challenging despite the benefits <strong>of</strong><br />
electrification.<br />
Much <strong>of</strong> the future patronage growth forecast for the rail network comes from areas<br />
where significant intensified residential land use in growth nodes has been assumed<br />
in the model. Future rail patronage growth, including from the electrified do minimum,<br />
is therefore likely to rely, in part, on the realization <strong>of</strong> these land use assumptions.<br />
1.2 Forecast patronage growth as a result <strong>of</strong> the CCRL<br />
1.2.1 <strong>Business</strong> <strong>Case</strong> approach<br />
The <strong>Business</strong> <strong>Case</strong> used two approaches to estimate patronage effects and<br />
transport benefits resulting from the project. Two ‗strategic scenarios‘, which did not<br />
use modelling inputs, were compared to form the basis for the trip estimates used in<br />
the report.<br />
Using the strategic scenarios approach, the <strong>Business</strong> <strong>Case</strong> estimated that there<br />
would be an additional 48,000 morning peak trips into the CBD in 2041 and that the<br />
CCRL would provide for 17,000 (35 percent) <strong>of</strong> these trips.<br />
The <strong>Business</strong> <strong>Case</strong> used <strong>Auckland</strong> Public Transport (APT) model outputs as a basis<br />
for its economic evaluation. Inputs to the APT modelling, such as land use<br />
assumptions and project assumptions, were generally consistent with the 2010<br />
<strong>Auckland</strong> Regional Land Transport Strategy (ARLTS). However, two adjustments<br />
were made where 2010 ARLTS assumptions were considered unrealistic by the<br />
<strong>Business</strong> <strong>Case</strong> consultants. Higher congestion inputs were used, consistent with<br />
results for modelling <strong>of</strong> the 2005 ARLTS, and a higher CBD parking change <strong>of</strong> $30<br />
per day (in 2006 values) was applied to reflect the scarcity <strong>of</strong> parking in an intensely<br />
developed CBD.<br />
The APT model does not reflect the impact <strong>of</strong> capacity constraints on rail or other<br />
modes. To address this issue, the <strong>Business</strong> <strong>Case</strong> assumed that all rail patronage<br />
growth ceased in 2024 in the do minimum scenario. This was based on the expected<br />
effect <strong>of</strong> constraints on rail services imposed by the configuration <strong>of</strong> the Britomart<br />
station, and the limited walking catchment <strong>of</strong> Britomart on the northern periphery <strong>of</strong><br />
the CBD.<br />
1.2.2 <strong>Review</strong> approach<br />
Having assessed the assumptions in the <strong>Business</strong> <strong>Case</strong>, all agencies involved in the<br />
<strong>Review</strong> agreed to use a revised set <strong>of</strong> input assumptions consistent with the 2010<br />
ARLTS, as a base case for transport modelling <strong>of</strong> the do minimum and the project.<br />
The key changes were to use parking change (at $16 per day in 2006 values) and<br />
congestion assumptions from the modelling <strong>of</strong> the 2010 ARLTS.<br />
While central government agencies have concerns over several aspects <strong>of</strong> the 2010<br />
ARLTS, assumptions from this strategy were used to ensure consistency with other<br />
appraisals and overall regional policy. On balance, central government agencies<br />
16
<strong>Auckland</strong> <strong>City</strong> <strong>Centre</strong> <strong>Rail</strong> <strong>Link</strong> <strong>Business</strong> <strong>Case</strong> <strong>Review</strong> | May 2011<br />
conclude that the assumptions in the 2010 ARLTS, particularly the land use<br />
assumptions, are beneficial to the project.<br />
A range <strong>of</strong> sensitivity tests, including the <strong>Business</strong> <strong>Case</strong>‘s higher congestion and<br />
parking charges assumptions, were also agreed.<br />
1.2.3 <strong>Review</strong> assessment <strong>of</strong> capacity constraints<br />
<strong>Rail</strong> capacity constraints reflect a combination <strong>of</strong> train carrying capacity, passengers‘<br />
willingness to board trains at different crowding levels, network limits on the<br />
frequency <strong>of</strong> train services and the handling capacity at key stations (largely<br />
Britomart).<br />
As noted, the model does not allow for the effect <strong>of</strong> capacity constraints, so these<br />
need to be assessed separately. To address this issue, the modelled forecast peak<br />
hour demand for the electrified do minimum scenario was compared to the capacity<br />
provided by new electric rolling stock on each <strong>of</strong> the three lines 6 . To ensure<br />
consistency with the <strong>Business</strong> <strong>Case</strong>, an all EMU fleet was assumed. Capacity was<br />
assumed to be reached when forecast demand exceeded a seated to standing ratio<br />
<strong>of</strong> 1:0.7 or required a standing time <strong>of</strong> longer than 20 minutes 7 .<br />
This analysis showed that standing times became an issue for some services on the<br />
Western Line from 2016 onwards and total capacity targets are likely to be exceeded<br />
in 2026. On the Southern Line, standing times become an issue from 2021 although<br />
the overall standing capacity target is not likely to be exceeded until about 2041 8 .<br />
The combined impact <strong>of</strong> these constraints was estimated to result in the loss <strong>of</strong><br />
approximately 3,000 rail trips (to other modes, deferred trips etc) in the morning peak<br />
in 2041 for the do minimum scenario. This is 10 percent <strong>of</strong> the total morning peak rail<br />
network trips forecast in 2041.<br />
Table 4: Potential reduction in AM peak rail network passenger numbers as a result <strong>of</strong> capacity<br />
constraint<br />
2016 2031 2041<br />
Western Line 256 847 1,240<br />
Southern Line 0 982 1,911<br />
Eastern Line 0 0 0<br />
Total 256 1,829 3,151<br />
These figures are sensitive to assumptions. The 1:0.7 ratio is less than ratios on<br />
mature Asian and European metro rail systems 9 but at this stage there is no<br />
evidence for what might be an appropriate ratio in <strong>Auckland</strong>. In practice, the impact<br />
<strong>of</strong> actual capacity constraints will depend on passenger willingness to accept higher<br />
loadings or longer standing times 10 . Passengers may be more or less willing to<br />
accept the standing time and loading ratios used in the analysis. However, this<br />
analysis does indicate that, while the rail constraints will result in potential patronage<br />
loss, rail patronage will still grow by an additional 5,000 trips in the morning peak<br />
between 2024 and 2041 across the network.<br />
6 An all EMU fleet was assumed in the <strong>Business</strong> <strong>Case</strong> as part <strong>of</strong> the do minimum.<br />
7 This is the ratio agreed with the former <strong>Auckland</strong> Regional Transport Authority in 2010 as a basis for high level<br />
design assumptions for the new EMU fleet.<br />
8 For the Southern Line with the CCRL, there is also overcrowding to a slightly greater extent until service<br />
frequencies are increased in 2031. No capacity constraints were identified on the Eastern Line.<br />
9 Although these systems may use different seating configurations within trains.<br />
10 For example if passengers on the Western Line were prepared to accept a standing time <strong>of</strong> 22 minutes instead <strong>of</strong><br />
the target 20 minutes, then the potential trip loss in 2041 would decrease from 1,240 to 870 passengers.<br />
17
<strong>Auckland</strong> <strong>City</strong> <strong>Centre</strong> <strong>Rail</strong> <strong>Link</strong> <strong>Business</strong> <strong>Case</strong> <strong>Review</strong> | May 2011<br />
1.2.4 <strong>Review</strong> patronage findings<br />
The impact <strong>of</strong> the project in increasing rail patronage and reducing bus passenger<br />
and car person trips is outlined below in Table 5. These figures come from the APT<br />
model using base case input, and have been adjusted to take account <strong>of</strong> capacity<br />
constraints.<br />
Table 5: Impacts <strong>of</strong> the CCRL (from APT modelling, allowing for capacity constraints)<br />
Passenger trips<br />
into the CBD in<br />
2041 morning peak<br />
Passenger trips on<br />
the wider network in<br />
2041 morning peak<br />
<strong>Rail</strong> Passenger trips in do minimum 11,378 28,149<br />
<strong>Rail</strong> passenger trips with CCRL 17,390 37,700<br />
Increase in passenger trips due to CCRL 6,012 9,551<br />
Reduction in bus passenger trips 4,000 5,700<br />
Reduction in car person trips Up to 2,000 Up to 3,851<br />
The <strong>Review</strong> also considered the share <strong>of</strong> forecast trips into the CBD that would be<br />
provided by the CCRL. The <strong>Business</strong> <strong>Case</strong>, using the scenario approach, estimated<br />
there would be 123,000 trips (including walking and cycling trips) into the CBD in the<br />
2041 morning peak period. These figures are significantly higher than the figures<br />
derived from the overall ART strategic model, which indicates that around 98,000 11<br />
car person and public transport passenger trips will enter the CBD during the 2041<br />
peak period. Consequently, the <strong>Review</strong> has used figures from the 2010 ARLTS as<br />
these provide a better comparison figure, particularly as consistent input assumptions<br />
were being used between the relevant models. ARLTS modelling forecasts an<br />
increase <strong>of</strong> 32,000 car person and public transport passenger trips into the CBD<br />
between 2006 and 2041.<br />
The analysis shows that there will be 6,000 additional rail trips into the CBD during<br />
the 2041 morning peak as a result <strong>of</strong> the project. This is a modest 19 percent <strong>of</strong> the<br />
additional 32,000 trips forecast into the CBD. Alternatively, the project accounts for<br />
around six percent <strong>of</strong> the total car and public transport trips forecast into the CBD in<br />
2041. The project would remove approximately 4,000 bus passenger trips<br />
(approximately 10 percent <strong>of</strong> total bus trips) and around 2,000 vehicle person trips<br />
(approximately five percent <strong>of</strong> car trips) into the CBD.<br />
The available modelling data does not provide a sound comparative figure between<br />
2006 and 2041 for bus trips. Nevertheless, the data indicates that, even with the<br />
CCRL in place, travel by bus will account for:<br />
65 percent <strong>of</strong> all passenger transport travel into the CBD in 2041<br />
around half <strong>of</strong> the increase in travel into the CBD expected up to 2041<br />
Table 6 provides a forecast <strong>of</strong> morning peak trips into the CBD by mode in 2041.<br />
Figures for share <strong>of</strong> travel into the CBD should be treated as ‗order <strong>of</strong> magnitude‘<br />
results as they require comparison <strong>of</strong> figures from different <strong>Auckland</strong> transport<br />
models 12 .<br />
11 This figure seems intuitively low given the predicted increase in employment, but does not include a large number<br />
<strong>of</strong> internal trips from the forecast increase in CBD residents. It also reflects the impact <strong>of</strong> ARLTS travel demand<br />
management (TDM) assumptions, which are expected to reduce car trips into the CBD by 21 percent.<br />
12 Unfortunately, the APT model only provides figures for public transport modes, so it has been necessary to draw<br />
on different data sources.<br />
18
<strong>Auckland</strong> <strong>City</strong> <strong>Centre</strong> <strong>Rail</strong> <strong>Link</strong> <strong>Business</strong> <strong>Case</strong> <strong>Review</strong> | May 2011<br />
Table 6: Forecast car person and public transport trips into the CBD in the 2041 morning peak by<br />
mode, with and without CCRL<br />
2006<br />
modelled<br />
(from<br />
2041: Revised<br />
Estimates<br />
(modelled figures<br />
Source<br />
model<br />
Share <strong>of</strong><br />
public<br />
transport<br />
Share <strong>of</strong> estimated car<br />
person and public<br />
transport trips in 2041<br />
2010<br />
ARLTS)<br />
unless stated<br />
otherwise)<br />
trips in<br />
2041<br />
Scenario Without With With Without With<br />
<strong>Rail</strong><br />
passengers<br />
Bus<br />
passengers<br />
Ferry<br />
passengers<br />
Total public<br />
transport<br />
trips<br />
Not<br />
available<br />
Not<br />
available<br />
Not<br />
available<br />
11,378 17,390<br />
APT<br />
(adjusted<br />
for rail<br />
constraint)<br />
29% 12% 18%<br />
42,675 38,622 APT 65% 43% 39%<br />
3,612 3,548 APT 6% 4% 4%<br />
22,986 57,665 59,560 APT 100%<br />
Car person 44,014 41,138 39,243<br />
Total car<br />
person and<br />
public<br />
transport<br />
trips<br />
Total minus<br />
public<br />
transport<br />
trips<br />
41% 39%<br />
67,000 98,803 98,803 ART3 100% 100%<br />
The 9,551 additional trips on the overall rail network as a result <strong>of</strong> the CCRL can be<br />
compared with the 840,000 13 passenger transport and vehicle person trips forecast,<br />
as part <strong>of</strong> the 2010 ARLTS, for the entire <strong>Auckland</strong> transport network during the 2041<br />
morning peak.<br />
1.2.5 Patronage forecasts and the reliability <strong>of</strong> the electrified network<br />
The government and the <strong>Auckland</strong> region will invest over $2 billion in the current<br />
programme <strong>of</strong> upgrading and electrifying <strong>Auckland</strong>‘s rail system. This will provide an<br />
expanded and more reliable network, new rolling stock and new and upgraded<br />
stations.<br />
Kiwi<strong>Rail</strong> has advised that while the current rail network upgrade and electrification<br />
will meet the objective <strong>of</strong> generally reliable 10-minute peak frequencies, there will be<br />
issues with operational risks, instability and low resilience that will not be fully<br />
mitigated by these projects. These problems will be exacerbated by the proposed<br />
addition <strong>of</strong> a station at Parnell.<br />
<strong>Auckland</strong> Transport has also highlighted operational risks at key points on the<br />
network: around Britomart, Britomart Tunnel, Quay Park Junction, the Newmarket<br />
Branch Line, Newmarket Junction, and Wiri Junction. <strong>Auckland</strong> Transport considers<br />
that while the network upgrade and electrification investment will mitigate the<br />
potential for these risks to adversely affect wider network reliability, it will not be<br />
possible to completely eliminate them.<br />
13 Analysis Supporting the Preferred Strategic Option: WP19, November 2010, pg 48 and 49.<br />
19
<strong>Auckland</strong> <strong>City</strong> <strong>Centre</strong> <strong>Rail</strong> <strong>Link</strong> <strong>Business</strong> <strong>Case</strong> <strong>Review</strong> | May 2011<br />
The patronage modelling in the <strong>Review</strong> has assumed the inclusion <strong>of</strong> the Parnell<br />
Station to ensure consistency with the ARLTS. However, there are concerns about<br />
the operational implications <strong>of</strong> Parnell Station on the wider network. The operational<br />
modelling conducted in early 2010 indicated that, without Parnell Station (which was<br />
outside the scope <strong>of</strong> the upgrade project), the Western and Southern Lines have<br />
suitable capacity to absorb delays in the turnaround time at Britomart as well as outer<br />
termini. The Eastern Line will be subject to delay from disturbances but the effect is<br />
likely to be small. Modelling shows that the inclusion <strong>of</strong> Parnell Station reduces<br />
allowable turnaround times at Britomart by a third (from six to four minutes) and<br />
therefore constrains the ability for the network to recover from delays 14 .<br />
Current network and station improvements are focused on 10-minute peak<br />
frequencies and the new trains will be purpose-built for metro operations, including<br />
rapid boarding and disembarking. However, it is also clear that there are several key<br />
risks including: actual passenger crowding thresholds and boarding times, and the<br />
performance <strong>of</strong> the network at key points. Much will depend on how effectively the<br />
network is operated and the extent to which service timetables mitigate the<br />
operational risks associated with the construction <strong>of</strong> Parnell Station. At this point, with<br />
electrification still 2 years away, central government <strong>of</strong>ficials consider there is<br />
insufficient evidence, and too many unknowns, to assess the level <strong>of</strong> disruption that<br />
may occur on the network as a result <strong>of</strong> crowding or operational issues, and the<br />
extent to which these issues may be resolved by the CCRL.<br />
1.3 Assessment <strong>of</strong> alternatives<br />
1.3.1 <strong>Business</strong> <strong>Case</strong> approach<br />
The <strong>Business</strong> <strong>Case</strong> considered alternative options to achieve the transport<br />
objectives, aside from the CCRL, but the transport impacts <strong>of</strong> these were not<br />
modelled nor were the costs estimated in all cases. The short list <strong>of</strong> options was:<br />
on Surface Bus Route Improvements<br />
a Central <strong>City</strong> Bus Tunnel with three stations<br />
an expanded Britomart Terminus (a third rail track between Newmarket and<br />
Britomart)<br />
As a result <strong>of</strong> the absence <strong>of</strong> empirical information on costs and benefits, the options<br />
were evaluated against the preferred CCRL option using a multi-criteria analysis, with<br />
the criteria scored by a group <strong>of</strong> workshop participants with transport systems<br />
expertise.<br />
1.3.2 <strong>Review</strong> findings<br />
The <strong>Review</strong>‘s main conclusion was that the analysis <strong>of</strong> alternatives did not meet<br />
Treasury <strong>Business</strong> <strong>Case</strong> guidelines for evaluating significant capital projects that<br />
require Crown funding. The guidelines set out an early approach <strong>of</strong> strategic<br />
assessment, investment logic mapping, development <strong>of</strong> a long list <strong>of</strong> options,<br />
selection <strong>of</strong> a short list <strong>of</strong> options and evaluation <strong>of</strong> the remaining options in terms <strong>of</strong><br />
their costs and benefits. The lack <strong>of</strong> a strategic front-end, and <strong>of</strong> a cost benefit<br />
analysis <strong>of</strong> the short list <strong>of</strong> options, reflects the origin <strong>of</strong> the <strong>Business</strong> <strong>Case</strong> as a<br />
specific request to enable route protection for the CCRL, for which the approach<br />
taken may well have been sufficient.<br />
14 If <strong>Auckland</strong> decides to proceed with this station, without further network improvements, changes to the service<br />
pattern or operating procedures will be needed to preserve overall network reliability.<br />
20
<strong>Auckland</strong> <strong>City</strong> <strong>Centre</strong> <strong>Rail</strong> <strong>Link</strong> <strong>Business</strong> <strong>Case</strong> <strong>Review</strong> | May 2011<br />
The absence <strong>of</strong> properly evaluated options in the <strong>Business</strong> <strong>Case</strong> means that it is not<br />
possible to conclude that the preferred option represents the best use <strong>of</strong> scarce<br />
resources, regardless <strong>of</strong> its estimated benefit cost ratio.<br />
As noted, the CCRL will carry 19 percent <strong>of</strong> the additional motorised journeys into the<br />
CBD, while bus services could be expected to carry around half <strong>of</strong> the additional<br />
trips. This raises the question <strong>of</strong> where bus capacity investment should sit alongside<br />
rail capacity investment in improving access to the CBD. It also indicates the need for<br />
a more sophisticated, multi-modal programme for ensuring optimised transport<br />
capacity into and within the CBD. Both the CCRL tunnel and the other options for<br />
solving the CBD transport problem need to be evaluated within this wider context.<br />
21
<strong>Auckland</strong> <strong>City</strong> <strong>Centre</strong> <strong>Rail</strong> <strong>Link</strong> <strong>Business</strong> <strong>Case</strong> <strong>Review</strong> | May 2011<br />
Appendix D: Transport benefits<br />
This appendix outlines the assessment <strong>of</strong> the transport benefits included in the<br />
<strong>Business</strong> <strong>Case</strong>, and the <strong>Review</strong> findings in relation to transport benefits. The <strong>Review</strong><br />
findings use the same set <strong>of</strong> modelling data presented for the patronage results in<br />
Appendix C.<br />
<strong>Auckland</strong> Council and <strong>Auckland</strong> Transport have noted that the <strong>Review</strong> identified and<br />
corrected issues with the <strong>Business</strong> <strong>Case</strong>. <strong>Auckland</strong> Council and <strong>Auckland</strong> Transport<br />
presented a new policy case in the final stages <strong>of</strong> the <strong>Review</strong>. This position has not<br />
been assessed as part <strong>of</strong> the <strong>Review</strong>, but is presented in Appendix E.<br />
1.1 Broad context<br />
The economic benefits are initially derived from the <strong>Auckland</strong> Public Transport (APT)<br />
model, which is run to calculate benefits for the Do Minimum (DM) and the project, or<br />
Do Something (DS), scenarios during the morning peak period in 2016 and 2041.<br />
The impacts <strong>of</strong> the project are identified by the difference between benefits for the<br />
DM and DS in each <strong>of</strong> the modelled years. Figures for other years are estimated by<br />
interpolation or extrapolation.<br />
1.2 The <strong>Business</strong> <strong>Case</strong> approach<br />
The APT model results for the <strong>Business</strong> <strong>Case</strong> modelling show that the project<br />
provides total incremental benefits <strong>of</strong> $41,000 for a single morning peak period in<br />
2016, which increase to $70,000 for a single morning peak in 2041. These benefits<br />
reflect the impact <strong>of</strong> the <strong>Centre</strong> <strong>City</strong> <strong>Rail</strong> <strong>Link</strong> (CCRL) in improving accessibility to the<br />
CBD, but they do not include the benefits <strong>of</strong> addressing the capacity constraint.<br />
Assuming a base annualisation factor <strong>of</strong> 840 15 (the figure commonly used in earlier<br />
evaluations using APT) these benefits would have a Net Present Value (NPV) <strong>of</strong><br />
$230 million over the evaluation period.<br />
The <strong>Business</strong> <strong>Case</strong> applied a higher annualisation factor to the total public transport<br />
benefits from the DS model results to reflect the expected greater use <strong>of</strong> the rail<br />
network in the interpeak and <strong>of</strong>f-peak periods. The annualisation factor for the project<br />
was increased from 840 in 2016 to 1,000 in 2041. The annualisation factor for the<br />
DM case was maintained at 840 on the assumption that, without the project, growth<br />
in interpeak and <strong>of</strong>f-peak rail use would not change. This resulted in an additional<br />
$285 million in project benefits, taking the cumulative subtotal to $515 million.<br />
The <strong>Business</strong> <strong>Case</strong> assumed that rail capacity constraints would begin in 2024,<br />
halting all growth in rail patronage from this year onwards. The economic effect <strong>of</strong><br />
this constraint assumption was modelled by capping the growth <strong>of</strong> all benefits out <strong>of</strong><br />
the APT model, including benefits from other public transport schemes, in 2024. This<br />
resulted in $455 million in additional project benefits, taking the cumulative subtotal to<br />
$970 million.<br />
The <strong>Business</strong> <strong>Case</strong> also applied a factor <strong>of</strong> 1.33 to all transport benefits to reflect the<br />
relief <strong>of</strong> congestion. This was based on the <strong>Business</strong> <strong>Case</strong> assumption that the<br />
modelled results did not fully capture the extent to which both car and bus congestion<br />
15 Annualisation factors are used to translate patronage and benefit outputs from the morning peak period model into<br />
annual figures. An annualisation factor <strong>of</strong> 840 therefore assumes that yearly benefits will be equivalent to 840 peak<br />
periods.<br />
22
<strong>Auckland</strong> <strong>City</strong> <strong>Centre</strong> <strong>Rail</strong> <strong>Link</strong> <strong>Business</strong> <strong>Case</strong> <strong>Review</strong> | May 2011<br />
would be relieved in the CBD as a result <strong>of</strong> the project. The factor resulted in an<br />
additional $385 million in project benefits, taking the cumulative total to $1,319<br />
million.<br />
In total, the adjustments applied in the <strong>Business</strong> <strong>Case</strong> increased the NPV <strong>of</strong> the<br />
benefits from a modelled base <strong>of</strong> $230 million to $1,319 million (or 570 percent).<br />
1.3 <strong>Review</strong> <strong>of</strong> the economic benefits<br />
The review tested the main transport and economic modelling assumptions used in<br />
the <strong>Business</strong> <strong>Case</strong>. The results are outlined below.<br />
1.3.1 Input Assumptions<br />
As noted in Appendix C, the <strong>Review</strong> considered the assumptions used in the<br />
transport modelling and agreed to an amended set <strong>of</strong> input assumptions as a base<br />
case for modelling the DM and DS. These changes to transport modelling<br />
assumptions were made to ensure consistency with the 2010 <strong>Auckland</strong> Regional<br />
Land Transport Strategy (ARLTS). A number <strong>of</strong> sensitivity tests were also agreed.<br />
The use <strong>of</strong> 2010 ARLTS congestion and parking charge assumptions resulted in<br />
marginal decreases in modelled benefits. Using the base annualisation factor <strong>of</strong> 840,<br />
the NPV <strong>of</strong> benefits decreased from $230 million to $220 million.<br />
1.3.2 Annualisation factors<br />
The Working Group agreed to apply consistent annualisation factors to both the DM<br />
and DS scenarios, although at a higher level than the <strong>Business</strong> <strong>Case</strong> to reflect recent<br />
increases in interpeak and <strong>of</strong>f-peak rail patronage. The Working Group also agreed<br />
to apply different annualisation factors for public transport user and decongestion<br />
benefits 16 . The figure <strong>of</strong> 1,100 was selected for public transport user benefits and 950<br />
for decongestion benefits.<br />
The <strong>Review</strong> identified a technical issue with the approach used to apply differential<br />
annualisation factors in the <strong>Business</strong> <strong>Case</strong> economic modelling. The application <strong>of</strong><br />
the factors to all public transport benefits from the model, rather than incremental<br />
benefits from the project, was found to be inappropriate. This approach applies a<br />
higher weighting to a much larger pool <strong>of</strong> benefits than those arising from the project<br />
itself and consequently inflated the result by attributing benefits from unrelated<br />
projects to the CCRL.<br />
The <strong>Review</strong> resolved this issue by applying the agreed annualisation factors to the<br />
incremental benefits arising from the new model runs. This added $50 million in<br />
benefits, taking the cumulative subtotal to $270 million.<br />
1.3.3 <strong>Review</strong> approach to economic effects <strong>of</strong> the capacity constraint<br />
As noted, the <strong>Business</strong> <strong>Case</strong> assessed the economic effect <strong>of</strong> the capacity<br />
constraints by capping all modelled benefits in the DM scenario, including those from<br />
bus projects, from 2024 onwards. However, in the DS scenario, the ‗cap‘ was<br />
removed and all <strong>of</strong> the benefits were attributed to the project. This approach<br />
overestimated the effect <strong>of</strong> the capacity constraint 17 and, like the annualisation<br />
factors issue, inappropriately applied benefits from other projects to the DS.<br />
16 This reflects the fact that the levels <strong>of</strong> congestion necessary to trigger the decongestion benefit in the simplified<br />
procedures in the EEM are not always present on the <strong>Auckland</strong> network (for example during <strong>of</strong>f peak periods).<br />
17 Appendix C discussed the effects <strong>of</strong> the capacity constraint.<br />
23
<strong>Auckland</strong> <strong>City</strong> <strong>Centre</strong> <strong>Rail</strong> <strong>Link</strong> <strong>Business</strong> <strong>Case</strong> <strong>Review</strong> | May 2011<br />
The <strong>Review</strong> applied an alternative approach to assessing the economic benefits from<br />
resolving the rail capacity constraint, which drew on the assessment, outlined in<br />
Appendix C, <strong>of</strong> the potential patronage losses from the constraint. The <strong>Review</strong><br />
approach increased the benefits <strong>of</strong> the CCRL by the proportion <strong>of</strong> DM passengers<br />
assumed to be deterred from using the rail network by the capacity constraint. The<br />
benefits from resolving the capacity constraint were assessed as $65 million, taking<br />
the cumulative subtotal to $335 million.<br />
1.3.4 Decongestion disbenefits in the do minimum<br />
The <strong>Review</strong> found significant issues with the <strong>Business</strong> <strong>Case</strong>‘s calculation <strong>of</strong><br />
decongestion disbenefits in the DM and the application <strong>of</strong> the 1.33 factor. In<br />
particular, the methodology appears to double count decongestion benefits already<br />
captured in the base modelling. It also applied this factor to the benefits to existing<br />
and new rail users, which are unaffected by CBD congestion.<br />
The <strong>Review</strong> concluded that an adjustment to reflect the relief <strong>of</strong> congestion in the<br />
CBD, particularly for bus travellers, is warranted. The <strong>Business</strong> <strong>Case</strong> consultants<br />
undertook new modelling and analysis to produce a new estimate for the effect <strong>of</strong><br />
CBD congestion. Although there were some issues with this approach, the results<br />
were included in the overall analysis, adding $52 million to the benefits and taking the<br />
cumulative total to $387 million.<br />
1.4 Final position<br />
Taking into account the changes in the modelling assumptions and post-modelling<br />
adjustments, the <strong>Review</strong> transport benefit estimate is $387 million, compared with<br />
$1,319 million estimated for the <strong>Business</strong> <strong>Case</strong>. The difference largely reflects the<br />
impact <strong>of</strong> resolving the technical issues with the <strong>Business</strong> <strong>Case</strong> economic modelling,<br />
which significantly increased the overall benefits, and the change to the final<br />
decongestion benefits. Changes to the modelling inputs, which impact equally on the<br />
DM and DS, have a relatively small impact. The differences are summarised in<br />
Table 7.<br />
Table 7: Comparison between <strong>Business</strong> <strong>Case</strong> and Peer <strong>Review</strong> estimates<br />
Figures are in $million, NPV <strong>Business</strong> <strong>Case</strong> <strong>Review</strong><br />
Additional Cumulative Additional Cumulative<br />
Model outputs (using an 840<br />
230 230 220 220<br />
annualisation factor on morning<br />
benefits)<br />
Application <strong>of</strong> revised annualisation<br />
285 515 50 270<br />
factors<br />
Application <strong>of</strong> capacity constraints 455 970 65 335<br />
Application <strong>of</strong> additional CBD<br />
congestion assumptions<br />
349 1,319 52 387<br />
Total benefits 1,319 1319 387 387<br />
24
<strong>Auckland</strong> <strong>City</strong> <strong>Centre</strong> <strong>Rail</strong> <strong>Link</strong> <strong>Business</strong> <strong>Case</strong> <strong>Review</strong> | May 2011<br />
1.5 Sensitivity tests undertaken<br />
A range <strong>of</strong> sensitivity tests 18 were undertaken to reflect uncertainty around some key<br />
assumptions and future policies as set out in Table 8 below.<br />
Table 8: Sensitivity Tests<br />
Assumption<br />
Benefits ($ million)<br />
Base line assessment 387<br />
ARLTS 2005 congestion factors and $30 daily<br />
parking charge. (This represents the modelled<br />
position underlying the <strong>Business</strong> <strong>Case</strong>) (test 1)<br />
Higher annual growth <strong>of</strong> public transport benefits (test<br />
2)<br />
400<br />
420<br />
Construction <strong>of</strong> Aotea Station only (test 3) 290<br />
Fares increased by 10 percent (test 4) 340<br />
Effects <strong>of</strong> more rapid growth in early part <strong>of</strong> period as<br />
a result <strong>of</strong> higher congestion than expected on road<br />
network (test 5)<br />
ARLTS 2010 congestion factors and enhanced<br />
parking charges. This has assumed that these start<br />
ramping up above the currently assumed levels in<br />
2022 on the opening <strong>of</strong> the CCRL and reach the full<br />
$30 by 2041 (test 6)<br />
420<br />
590 <strong>of</strong> which very approximately<br />
400 million is in respect <strong>of</strong> the<br />
CCRL and the balance to other<br />
public transport services<br />
While for most <strong>of</strong> the sensitivity tests the effects are relatively small, the increase in<br />
benefits for sensitivity test 6 (increasing parking charges with the CCRL after 2022) is<br />
more substantial. This sensitivity test is intended to reflect an AC decision to seek to<br />
increase average real daily parking charges to $30 on the basis that the CCRL will<br />
provide a high quality alternative to car travel. The benefits increase substantially<br />
because all forms <strong>of</strong> public transport, particularly bus, would benefit after 2021.<br />
An attempt has been made to separate out the effects <strong>of</strong> the higher parking charges<br />
on the CCRL from the effects on the rest <strong>of</strong> the network. Although it is difficult to<br />
distinguish the two effects, the modelling suggests that this latter element would be<br />
substantial. Therefore, this proposal should ideally be considered in a wider context<br />
than just for the CCRL. However, the increase in bus trips associated with higher<br />
parking charges is likely to magnify expected difficulties with congestion in this mode.<br />
Sensitivity tests were also undertaken to reflect the impact <strong>of</strong> different appraisal<br />
assumptions. The <strong>Review</strong> has assessed the project using the standard government<br />
discount rate <strong>of</strong> eight percent, and an appraisal period beginning when major<br />
investment is required. <strong>Auckland</strong> Council and <strong>Auckland</strong> Transport hold the view that<br />
lower discount rates and longer appraisal periods should be used for transport<br />
projects which deliver their benefits over long periods. The results <strong>of</strong> the appraisal<br />
assumption sensitivity tests are set out in Table 9.<br />
18 Sensitivity tests 1-3 and, 5 and 6 include an allowance for the effects <strong>of</strong> capacity constraints and bus decongestion<br />
effects where appropriate. Although no information was available to assess this for test 4, this assumed the same<br />
level <strong>of</strong> constraint as for the base which was considered to give a reasonable position, given the other<br />
approximations that were made in the testing <strong>of</strong> this scenario.<br />
25
<strong>Auckland</strong> <strong>City</strong> <strong>Centre</strong> <strong>Rail</strong> <strong>Link</strong> <strong>Business</strong> <strong>Case</strong> <strong>Review</strong> | May 2011<br />
Table 9: Alternative Evaluation Scenarios (NPV <strong>of</strong> direct transport benefits $m)<br />
Discount rate <strong>of</strong> 8 percent 387<br />
Discount rate <strong>of</strong> 6 percent 570<br />
Discount rate <strong>of</strong> 4 percent 850<br />
Evaluation over 30 years <strong>of</strong> operation 440<br />
1.6 Compliance with the Economic Evaluation Manual (EEM)<br />
Significant parts <strong>of</strong> the <strong>Business</strong> <strong>Case</strong> assessment were not compliant with the<br />
procedures outlined in the NZTA‘s EEM for calculating transport benefits. Most <strong>of</strong><br />
these issues could not be resolved by the <strong>Review</strong> in the time available and therefore<br />
the <strong>Review</strong> is also non-compliant. Nevertheless, any future assessment <strong>of</strong> the project<br />
presented to government should comply with recommended procedures in the EEM.<br />
1.7 <strong>Auckland</strong> Council and <strong>Auckland</strong> Transport position<br />
As noted, <strong>Auckland</strong> Council and <strong>Auckland</strong> Transport have provided a Position on<br />
Transport Related Patronage and Benefits. This is included in Appendix E.<br />
Central government agencies note that the <strong>Auckland</strong> Council/<strong>Auckland</strong> Transport<br />
policy case was presented during the final stages <strong>of</strong> the <strong>Review</strong>. Central government<br />
agencies have not had time, or been provided with the background information, to<br />
assess the range <strong>of</strong> technical issues raised by the position in detail.<br />
Nevertheless, central government agencies note that some <strong>of</strong> the interventions<br />
included in the position — particularly the additional park and ride and reconfiguration<br />
<strong>of</strong> bus routes — could be used to increase the benefits from both the DM and the DS,<br />
if included as part <strong>of</strong> a package. Therefore, it does not seem valid to attribute the<br />
increased benefits to the CCRL only, as is apparently being proposed by the<br />
<strong>Auckland</strong> Council/<strong>Auckland</strong> Transport policy case. This issue, and the practical basis<br />
for the changed modelling assumptions which underpin the case, will need to be<br />
explored and clarified in any future revision <strong>of</strong> the <strong>Business</strong> <strong>Case</strong>.<br />
26
<strong>Auckland</strong> <strong>City</strong> <strong>Centre</strong> <strong>Rail</strong> <strong>Link</strong> <strong>Business</strong> <strong>Case</strong> <strong>Review</strong> | May 2011<br />
Appendix E: <strong>Auckland</strong> Council/<strong>Auckland</strong> Transport position<br />
on transport related patronage and benefits<br />
The following sets out the <strong>Auckland</strong> Council and <strong>Auckland</strong> Transport position on<br />
transport related patronage and benefits.<br />
1.1 <strong>Auckland</strong>’s growing transport demands<br />
The roading projects planned for <strong>Auckland</strong> cannot on their own meet its population<br />
growth. <strong>Auckland</strong>‘s population is expected to grow to around 2.3 million people by<br />
2051 – an increase <strong>of</strong> almost one million people from today‘s population and<br />
accounting for around 70 percent <strong>of</strong> New Zealand‘s population growth over this<br />
period.<br />
This growth will increase travel demand for people by around 64 percent. Freight<br />
trips are expected to more than double. Once work underway to deliver a properly<br />
connected motorway and arterial roading network is completed there will be virtually<br />
no more designations for major new roads in <strong>Auckland</strong>‘s built up urban area, making<br />
major new roads much more expensive, environmentally challenging and impacting<br />
more on communities.<br />
Rapid transit (rail and busways) benefits both the users <strong>of</strong> the system, and those that<br />
continue to drive. It has the ability to move more people more efficiently than other<br />
modes, freeing up our congested motorways and arterials for freight, commercial,<br />
and other trips vital to economic development that cannot use public transport.<br />
27
<strong>Auckland</strong> <strong>City</strong> <strong>Centre</strong> <strong>Rail</strong> <strong>Link</strong> <strong>Business</strong> <strong>Case</strong> <strong>Review</strong> | May 2011<br />
A single lane <strong>of</strong> motorway<br />
Bus lanes<br />
Dedicated busway<br />
Dedicated light rail<br />
<strong>Auckland</strong>‘s rail corridors<br />
Capacity per Hour<br />
2,400 people<br />
7,500 people<br />
12,000 people<br />
12,000 people<br />
20,000 – 25,000 people<br />
Up to 2016, the current rail upgrade will enable electrification <strong>of</strong> the network and<br />
achieve 10 minute frequencies on each rail corridor. The electrification business case<br />
identified a strategic benefit <strong>of</strong> electrification is that it enables future expansion <strong>of</strong> the<br />
rail network including the underground <strong>City</strong> <strong>Centre</strong> <strong>Rail</strong> <strong>Link</strong> (CCRL).<br />
However, without the CCRL the future development <strong>of</strong> the city centre will be<br />
compromised by its constrained transport network making it harder for people, goods<br />
and services to get to and around the city centre to do business and access its<br />
international economic, education, cultural and tourist opportunities.<br />
The constraint in the roading network has already occurred with most approaches<br />
to the city centre at or near capacity in the peak periods.<br />
The bus network is already under pressure with significant constraints occurring<br />
from 2014 along Symonds Street and from 2016 along Albert Street.<br />
The constraint in the rail network occurs in 2016.<br />
As these constraints come into play and become more severe, the city centre will<br />
suffer in economic terms and without a clear commitment to resolve these constraints<br />
with the CCRL, investment in the city centre will be deferred.<br />
<strong>Auckland</strong>‘s rapid transit future includes both rail and buses doing what they are most<br />
efficient at doing and constraints in the network will require both bus and rail<br />
solutions. <strong>Rail</strong> is better than buses at addressing traffic congestion in the <strong>Auckland</strong><br />
isthmus congested transport corridors because the established rail corridors provide<br />
separate rights <strong>of</strong> way unaffected by road congestion and have significant spare<br />
capacity once the Britomart constraint is released. Furthermore, initial indications are<br />
that the <strong>Auckland</strong> Plan envisages land use development being concentrated around<br />
stations.<br />
The bulk <strong>of</strong> the Central <strong>City</strong> is not within<br />
walking distance <strong>of</strong> current stations<br />
The bulk <strong>of</strong> the Central <strong>City</strong> will be within<br />
walking distance <strong>of</strong> current stations once the<br />
Central <strong>City</strong> link is constructed<br />
28
<strong>Auckland</strong> <strong>City</strong> <strong>Centre</strong> <strong>Rail</strong> <strong>Link</strong> <strong>Business</strong> <strong>Case</strong> <strong>Review</strong> | May 2011<br />
Beyond 2016 the key rail extension is the CCRL tunnel which has three main benefits<br />
that will unleash the economic potential and productivity <strong>of</strong> the city centre – the<br />
country‘s single largest concentration <strong>of</strong> economic activity.<br />
a) Providing three additional city centre stations creating excellent direct rail access<br />
to city centre commercial, employment, shopping, tourist and cultural activities<br />
unaffected by road congestion.<br />
b) Removing the constraint at Britomart rail terminus allows dramatically improved<br />
train frequencies on the whole rail system.<br />
c) Facilitating the agglomeration benefits <strong>of</strong> concentrated economic development in<br />
the city centre which has benefits for the national economy. This requires a high<br />
quality rapid transit service that is not only unaffected by road congestion, but also<br />
improves freight and commuter times for those that continue to drive.<br />
1.2 The <strong>Auckland</strong> Council/<strong>Auckland</strong> Transport option case<br />
<strong>Auckland</strong> Council/<strong>Auckland</strong> Transport believe that the <strong>Review</strong> <strong>of</strong> the <strong>Business</strong> case<br />
identified and corrected technical issues with the calculation <strong>of</strong> transport benefits set<br />
out in the APB&B <strong>Business</strong> <strong>Case</strong>. <strong>Auckland</strong> Council/<strong>Auckland</strong> Transport also believe<br />
that the base case accurately reflects assumptions based on some past trends and<br />
that the base case represents a lower bound for the estimates <strong>of</strong> future patronage<br />
and transport benefits that would be generated by the CCRL.<br />
However, <strong>Auckland</strong> Council/<strong>Auckland</strong> Transport do not believe the base case<br />
represents a true estimate <strong>of</strong> the likely patronage potential and transport benefits <strong>of</strong><br />
the CCRL and have identified some important policy aspects that need to be taken<br />
into account. <strong>Auckland</strong> Council/<strong>Auckland</strong> Transport believe that these establish an<br />
upper estimate <strong>of</strong> future patronage and benefits <strong>of</strong> the CCRL and have identified a<br />
policy case comprising the following.<br />
Improved bus feeder services – a review <strong>of</strong> the modelling undertaken during the<br />
<strong>Business</strong> <strong>Case</strong> identified that while improvements to bus feeders was made,<br />
there was considerable scope to further improve these given the circa $2 billion<br />
investment in the CCRL, and these would result in additional rail trips to the city<br />
centre.<br />
Improved park and ride – a key policy will be the opportunity to improve park and<br />
ride opportunities at rail stations, to support the $2 billion investment in the CCRL.<br />
We have re-examined the extensive work that was done in relation to the rail<br />
Mode Specific Constant (MSC) during the development <strong>of</strong> the APT model. This<br />
concluded, inter alia, that the rail MSC would fall by three minutes when the rail<br />
timetable was extended to cover evenings and weekends, by a further 1.5<br />
minutes with refurbished rolling stock and a further 1.5 minutes with new rolling<br />
stock. This is based on extensive experience elsewhere, including the<br />
introduction <strong>of</strong> new rolling stock in Perth. The CCRL will improve reliability,<br />
frequency and also extend the penetration <strong>of</strong> rail in the CBD and these factors<br />
will lead to a further change in MSC. In the light <strong>of</strong> the earlier work this change<br />
was set at four minutes.<br />
Increased CBD parking costs to $30 per day by 2041 in real terms. This was an<br />
agreed sensitivity test undertaken in the <strong>Review</strong> and, given the significant<br />
investment in the CCRL, is an important policy instrument at the disposal <strong>of</strong><br />
<strong>Auckland</strong> Council/<strong>Auckland</strong> Transport (which could also reflect some form <strong>of</strong><br />
future road pricing). Table 10 shows that the price <strong>of</strong> parking already is<br />
29
<strong>Auckland</strong> <strong>City</strong> <strong>Centre</strong> <strong>Rail</strong> <strong>Link</strong> <strong>Business</strong> <strong>Case</strong> <strong>Review</strong> | May 2011<br />
approaching or above $16 per day on average (assumed in the base case to<br />
occur by 2041).<br />
We have assessed the increased patronage impacts <strong>of</strong> additional employment<br />
that could be generated by the CCRL, particularly around stations where the<br />
District Plan and other tools could be used to facilitate increased land uses over<br />
and above those assumed in the modelling. Reasons why we believe the CCRL<br />
will generate increased employment opportunities include:<br />
o<br />
o<br />
o<br />
o<br />
Greater development density can be achieved as less space is required for<br />
parking.<br />
There is an assurance over the life <strong>of</strong> buildings that reliable transport is in<br />
place to cope with demands.<br />
Major public and private investment will be attracted once the CCRL is in<br />
place.<br />
As there is no agreement on what this future increase could be, a range <strong>of</strong><br />
between 5,000 and 20,000 additional employees was assumed.<br />
Table 10: Parking Prices in <strong>Auckland</strong> CBD Parking Garages (April 2011)<br />
Car park<br />
Cost <strong>of</strong> all day early bird<br />
parking<br />
Mercury lane (ACC) $8<br />
Downtown (ACC) $12<br />
Civic (ACC) $12<br />
Fanshawe St (ACC) $10<br />
Victoria St (ACC) $12<br />
Hobson St (Wilsons) $10<br />
IAG house (Wilsons) $20<br />
Lower Albert St (Wilsons) $13<br />
ANZ centre (Wilsons) $14<br />
Corner Wellesley St/Nelson St/Cook St<br />
(Tournament)<br />
$8 Lower level<br />
$9 Upper level<br />
$10 Under Cover<br />
Graham St (Tournament) $17<br />
450 Queen Street (Tournament) $12<br />
Corner Stanley St and Alten Rd (Tournament) $11<br />
Fort Street, <strong>Auckland</strong> CBD (Tournament)<br />
$20 (only 20 spaces)<br />
Shortland St (Tournament) $15<br />
Lumley <strong>Centre</strong> (Tournament) $17<br />
<strong>City</strong> <strong>Centre</strong> 82 - 84 Albert Street (Tournament) $13.00 (LG - 4)<br />
$12.00 (L5 & 6)<br />
49 Symonds Street (Tournament) $12.00<br />
Hyatt (Tournament) $14<br />
St Matthews (Tournament) $12<br />
<strong>Rail</strong>way Campus – Indoor (Tournament) $15<br />
30
<strong>Auckland</strong> <strong>City</strong> <strong>Centre</strong> <strong>Rail</strong> <strong>Link</strong> <strong>Business</strong> <strong>Case</strong> <strong>Review</strong> | May 2011<br />
Table 11: Forecast Trips into the CBD by Mode; base case results compared with policy case<br />
results (Morning peak period: 07:00- 09:00)<br />
Mode<br />
2006<br />
(from 2010<br />
ARLTS<br />
modelling)<br />
Observed<br />
counts<br />
2041: Revised MoT<br />
Base <strong>Case</strong> Estimates<br />
(modelled figures<br />
unless stated<br />
otherwise)<br />
No CCRL<br />
CCRL in<br />
Place<br />
AC/AT<br />
Policy<br />
case<br />
modelled<br />
estimates<br />
(CCRL in<br />
place)<br />
Total Trips<br />
@ 20,000<br />
extra <strong>City</strong><br />
<strong>Centre</strong><br />
Employees<br />
Total Trips<br />
@ 5,000<br />
extra <strong>City</strong><br />
<strong>Centre</strong><br />
Employees<br />
(1) (2) (3) (4) (5) (6) (7)<br />
<strong>Rail</strong> 4,131 11,378 17,390 23,810 30,983 25,603<br />
Bus 22,251 42,675 38,622 39,639 44,421 40,835<br />
Ferry 3,297 3,612 3,548 4,256 5,058 4,456<br />
Total PT 22,986 29,679 57,665 59,560 67,705 80,463 70,894<br />
Car persons<br />
(inferred)<br />
44,014 41,138 39,243 31,098 36,958 32,563<br />
Total<br />
mechanised<br />
67,000 98,803 98,803 98,803 117,420 103,457<br />
Active 7,338 7,338 7,338 8,721 7,684<br />
Total 106,141 106,141 106,141 126,141 111,141<br />
In Table 11, columns 1, 3 and 4 are taken directly from the Transport Technical<br />
Aspects <strong>Review</strong>. The following observations can be made.<br />
Comparing columns (1) and (2) it can be seen that the models underestimated<br />
the total 2006 public transport demands into the CBD by 6,600 trips, or 29<br />
percent.<br />
Comparing the central government agencies base case with the CCRL in place<br />
(column (4)) with the <strong>Auckland</strong> Council/<strong>Auckland</strong> Transport policy case (Column<br />
5)), 6,400 additional rail passengers are estimated to use the CCRL, representing<br />
12,400 more rail passengers than if there was no rail tunnel (column (3)). This<br />
would remove around 10,000 car trips from the city centre each peak period. The<br />
underestimate <strong>of</strong> public transport patronage into the city centre in 2006 by the<br />
model, indicates that the patronage uptake (and transport benefits) identified in<br />
the policy case could also be significantly underestimated.<br />
When considering the possible impacts <strong>of</strong> additional patronage resulting from<br />
increased employment resulting from the provision <strong>of</strong> the CCRL shown in<br />
columns (6) and (7), it can be seen that the CCRL could attract up to between<br />
25,600 passengers and 31,000 passengers, depending on the level <strong>of</strong> additional<br />
employment.<br />
Table 11 also shows that <strong>of</strong> the public transport demands, bus remains the most<br />
significant and this makes it clear that the CCRL cannot be considered in isolation <strong>of</strong><br />
a wider and more cost effective set <strong>of</strong> solutions to deal with the whole <strong>of</strong> the transport<br />
demand faced by the city centre over the next 20 to 30 years. In this regard, the<br />
opportunity <strong>of</strong>fered by the CCRL to increase its role in meeting future demands has<br />
not been fully optimised, because even at eight trains per hour (tph) on each <strong>of</strong> the<br />
four <strong>of</strong> the routes, the CCRL has spare capacity to run more services (up to 30 tph in<br />
each direction). Therefore additional services could be added to respond to peak<br />
demands and to enable further rationalisation <strong>of</strong> bus services to the city centre. As<br />
well as providing bus operating cost savings, it would free up city centre street<br />
capacity for bus service growth from areas not served by rail.<br />
31
<strong>Auckland</strong> <strong>City</strong> <strong>Centre</strong> <strong>Rail</strong> <strong>Link</strong> <strong>Business</strong> <strong>Case</strong> <strong>Review</strong> | May 2011<br />
While the number <strong>of</strong> trains operating into Britomart without the CCRL in place will not<br />
increase after electrification, the station will be operating at close to its train capacity.<br />
Moreover it is expected that patronage will continue to increase after electrification<br />
from organic growth, i.e. the trains will get progressively fuller going into Britomart –<br />
particularly if accelerated bus feeder services, fuel prices continue increasing or more<br />
aggressive park and ride policies are pursued. Having more people boarding and<br />
alighting from trains at Britomart is likely to stress the station facilities (pedestrian<br />
access/ egress/ concourse areas) thus increasing the likelihood <strong>of</strong> service reliability<br />
issues arising from longer train turnaround times and other incidents. Given that the<br />
timetable is completely Britomart centric, delays to trains at or near Britomart <strong>of</strong>ten<br />
cause knock-on delays across the network. These reliability issues at Britomart will<br />
manifest themselves as disbenefits to passengers and it has been established that<br />
unpredictable delays have a particularly high value <strong>of</strong> time for passengers compared<br />
to that for in-vehicle time.<br />
The impact that the <strong>Auckland</strong> Council/<strong>Auckland</strong> Transport policy case would have on<br />
transport benefits estimated using the revised and corrected methodology developed<br />
by central government agencies is shown in Table 12.<br />
Table 12: Overall result - Transport Benefits<br />
<strong>Business</strong> <strong>Case</strong> ($m) <strong>Review</strong> – base case ($m) AC/AT policy case ($m)<br />
Model outputs (using an<br />
840 annualisation factor on<br />
AM benefits)<br />
Application <strong>of</strong> revised<br />
annualisation factors<br />
Application <strong>of</strong> capacity<br />
constraints<br />
Application <strong>of</strong> CBD<br />
congestion assumptions<br />
Additional Cumulative Additional Cumulative Additional Cumulative<br />
230 230 220 220 548 548<br />
285 515 50 270 112 660<br />
455 970 65 335 203 863<br />
349 1,319 52 387 94 957<br />
Extra CBD employment -<br />
low<br />
62 1,019<br />
Extra CBD employment -<br />
high<br />
249 1,206<br />
Benefits from reduced<br />
unreliability as a result <strong>of</strong><br />
173<br />
overcrowding<br />
Total benefits 1,319 1,319 387 387 1,192 / 1,379<br />
1.3 Conclusion<br />
The <strong>Review</strong> <strong>of</strong> the <strong>Business</strong> <strong>Case</strong> has identified some issues with the <strong>Business</strong> <strong>Case</strong><br />
calculation <strong>of</strong> transport benefits and corrected these. The <strong>Review</strong> base case in our<br />
view represents a lower bound to the transport patronage and benefits. The Policy<br />
case in our view represents an upper bound.<br />
<strong>Auckland</strong> Council/<strong>Auckland</strong> Transport have calculated that the expected rail trips as<br />
a result <strong>of</strong> the CCRL in 2041 are between 23,800 and 31,000 compared to the<br />
17,400 in the <strong>Review</strong> base case and the transport benefits <strong>of</strong> the CCRL are between<br />
$1.2 billion and $1.4 billion compared to the $387 million in the central government<br />
agencies base case.<br />
32
<strong>Auckland</strong> <strong>City</strong> <strong>Centre</strong> <strong>Rail</strong> <strong>Link</strong> <strong>Business</strong> <strong>Case</strong> <strong>Review</strong> | May 2011<br />
The key reasons for these differences are:<br />
improved bus/rail feeder services<br />
wider park and ride provision<br />
increased real city centre parking prices by 2041<br />
improving the ability <strong>of</strong> the model to reflect the significant enhancement to the<br />
electrified rail network enabled by the CCRL by adjusting the mode constant<br />
capturing the patronage impacts <strong>of</strong> additional city centre development enabled by<br />
the CCRL<br />
There are four important conclusions to be made.<br />
The policy case shows clear evidence that the CCRL significantly benefits both<br />
users <strong>of</strong> the service and those that continue to drive and is a worthwhile transport<br />
project to meet the future growth needs <strong>of</strong> the city centre.<br />
The electrification business case identified that a strategic benefit <strong>of</strong> electrification<br />
was that it allowed the expansion <strong>of</strong> the network through construction <strong>of</strong> the<br />
underground CCRL. By removing the capacity constraint at Britomart, together<br />
with the cheaper per kilometre operational cost <strong>of</strong> electric trains compared to<br />
diesels, means that the CCRL enables the rail network to be extended further.<br />
The additional patronage opportunities as well as the benefits and costs <strong>of</strong> any<br />
future extensions are not included in these figures.<br />
There are significant risks to the project <strong>of</strong> commercial development occurring on<br />
the route which would add significant costs, delay the timing <strong>of</strong> the project or<br />
preclude it from ever occurring in its current agreed form for the foreseeable<br />
future. Because <strong>of</strong> this, the route should be protected immediately.<br />
The wide difference between the policy and base cases clearly shows that the<br />
APB&B <strong>Business</strong> <strong>Case</strong> does not provide a robust case for government funding in<br />
terms <strong>of</strong> the Treasury‘s Better <strong>Business</strong> <strong>Case</strong> guidelines and Capital Asset<br />
Management Framework. These guidelines were still being finalised at the time<br />
the APB&B <strong>Business</strong> <strong>Case</strong> was being completed. Any application for government<br />
funding would need to follow these guidelines.<br />
33
<strong>Auckland</strong> <strong>City</strong> <strong>Centre</strong> <strong>Rail</strong> <strong>Link</strong> <strong>Business</strong> <strong>Case</strong> <strong>Review</strong> | May 2011<br />
Appendix F: Employment projections and wider economic<br />
benefits<br />
1.1 Context<br />
Identifying and quantifying employment change and wider economic benefits (WEBs)<br />
which result from transport infrastructure projects is challenging, and is a developing<br />
area internationally. Nevertheless, a formalised methodology for estimating these<br />
benefits is necessary to enable comparisons between projects and to ensure that<br />
claimed benefits are robust and are based on evidence and parameters specific to<br />
New Zealand.<br />
At present, the NZ Transport Agency‘s (NZTA) Economic Evaluation Manual (EEM)<br />
provides for the appraisal <strong>of</strong> agglomeration benefits in project assessments.<br />
Agglomeration benefits are essentially the benefits to firms from increases in<br />
effective employment density.<br />
Agglomeration is not the only potential form <strong>of</strong> WEB that has been identified in the<br />
literature. The NZTA is currently completing a research programme to identify best<br />
practice methodologies and New Zealand-specific evidence for calculating a broader<br />
range <strong>of</strong> WEBs. The findings from the research programme provide support for<br />
extensions to WEBs methodology, based on the United Kingdom Department for<br />
Transport‘s approach, to incorporate additional benefit categories including:<br />
imperfect competition effects: allowing for the existence <strong>of</strong> a mark-up between the<br />
gross labour cost/time saving and the market value to a business <strong>of</strong> what is<br />
produced in an hour<br />
labour supply effects: in an imperfect market, improvements in transport could<br />
encourage a net increase in the number <strong>of</strong> individuals that seek and find work<br />
job relocation effects: where firms shift location to more productive locations (eg<br />
the CBD) there is an externality benefit, the ‗tax wedge‘, for each job that<br />
relocates<br />
increased competition effects<br />
Benefits from imperfect competition, labour supply and job relocation have been<br />
considered in the <strong>Review</strong> <strong>of</strong> the <strong>City</strong> <strong>Centre</strong> <strong>Rail</strong> <strong>Link</strong> (CCRL). Increased competition<br />
effects were not calculated due to methodology and data issues.<br />
1.2 The <strong>Review</strong> approach<br />
The <strong>Review</strong> commissioned Steer Davis Gleave UK (SDG) to peer review the<br />
<strong>Business</strong> <strong>Case</strong> and advise on the additional WEBs from the CCRL. SDG undertook<br />
the NZTA‘s research programme on additional WEBs and developed the draft<br />
methodology, so were well placed to inform the <strong>Review</strong> on best practice.<br />
1.3 Agglomeration benefits<br />
The <strong>Business</strong> <strong>Case</strong> estimated agglomeration benefits at $185 million.<br />
SDG‘s peer review identified a number <strong>of</strong> issues with the methodology used in the<br />
<strong>Business</strong> <strong>Case</strong>, and at the request <strong>of</strong> the Working Group, revisions were made by<br />
the <strong>Business</strong> <strong>Case</strong> consultants. The methodology used to calculate agglomeration<br />
34
<strong>Auckland</strong> <strong>City</strong> <strong>Centre</strong> <strong>Rail</strong> <strong>Link</strong> <strong>Business</strong> <strong>Case</strong> <strong>Review</strong> | May 2011<br />
benefits in the <strong>Business</strong> <strong>Case</strong> was based on a ―pseudo-conventional benefit‖ factor,<br />
which was originally set at 14 percent <strong>of</strong> the conventional transport benefits, and was<br />
subsequently revised to 33 percent in response to SDG comment. Central<br />
government <strong>of</strong>ficials had significant reservations with the methodology, particularly as<br />
the rationale for the approach was unclear and the methodology inconsistent with the<br />
EEM. However, it was adopted by default as the issues were identified late in the<br />
process and there was insufficient time to apply the correct methodology.<br />
The <strong>Business</strong> <strong>Case</strong> did not include these benefits in the calculation <strong>of</strong> the urban<br />
regeneration benefits (see section 1.5) benefit cost ratio to avoid double counting.<br />
SDG advised that, if job relocation is calculated accurately, the two impacts are<br />
separate and additive. Therefore the Working Group agreed to add agglomeration to<br />
the benefits outlined in section 1.6.<br />
Central government agencies consider agglomeration is, as an upper bound, 33<br />
percent <strong>of</strong> $387 million (the conventional benefits identified in the <strong>Review</strong>) or $128<br />
million.<br />
<strong>Auckland</strong> Council accept the 33 percent figure but consider it needs to be applied<br />
against the conventional transport benefits as identified in the <strong>Auckland</strong><br />
Council/<strong>Auckland</strong> Transport policy case (see Appendix E). <strong>Auckland</strong> Council <strong>of</strong>ficers<br />
further note that the recalculation does not capture reallocation <strong>of</strong> employment<br />
across the region and therefore only partially captures agglomeration benefits.<br />
The <strong>Business</strong> <strong>Case</strong> consultants argued that agglomeration benefits would increase<br />
to 52 percent <strong>of</strong> conventional benefits if allowance is made for growth in productivity<br />
over time. While this is inconsistent with the EEM, which holds all cost and benefit<br />
values constant, the Working Group agreed to include this as a sensitivity test as<br />
outlined in Table 13.<br />
Table 13: Sensitivity analysis <strong>of</strong> agglomeration benefits<br />
Scenario<br />
Central government<br />
agencies position<br />
AT / AC low (5,000<br />
additional jobs) employment<br />
position<br />
AT / AC high (20,000<br />
additional jobs) employment<br />
position<br />
Conventional<br />
benefits ($m)<br />
Agglomeration<br />
($m) at 33%<br />
Agglomeration<br />
($m) at 52%<br />
387 128 201<br />
1,192 393 620<br />
1,379 455 717<br />
1.4 Effects on employment relocation<br />
The <strong>Business</strong> <strong>Case</strong> proposes that the CCRL will encourage businesses and<br />
employees to locate in the CBD where they will be more productive, with positive<br />
effects for the wider economy. <strong>Auckland</strong> Council <strong>of</strong>ficers agree with this view but<br />
consider that the CCRL‘s impact will extend beyond the CBD to other centres on the<br />
rail network.<br />
1.4.1 Employment projections<br />
In relation to the CBD, the 2010 <strong>Auckland</strong> Regional Land Transport Strategy<br />
(ARLTS) assumes:<br />
35
<strong>Auckland</strong> <strong>City</strong> <strong>Centre</strong> <strong>Rail</strong> <strong>Link</strong> <strong>Business</strong> <strong>Case</strong> <strong>Review</strong> | May 2011<br />
an increase in the residential population <strong>of</strong> 84,000, from 17,900 in 2006 to<br />
102,000 in 2041<br />
an increase in full time equivalent jobs <strong>of</strong> 58,305, from 63,800 in 2006 to 122,105<br />
in 2041<br />
The ARLTS land use inputs are based on the former <strong>Auckland</strong> Regional Council‘s<br />
Regional Growth Strategy, as embodied in Plan Change Six. Land use categories<br />
were manually adjusted on a zone by zone basis to match the Plan Change 6<br />
desired outcomes for each zone.<br />
Achieving the ARLTS forecasts for CBD employment will require an increased rate <strong>of</strong><br />
employment growth in the CBD in comparison to past trends. It will also require the<br />
CBD to increase its share <strong>of</strong> overall employment. The available data outlined below<br />
in Table 14, shows recent average annual growth rates, for a 9 to 10 year period, <strong>of</strong><br />
between 1.4 and 1.7 percent, with a peak <strong>of</strong> around 2.0 percent during the period <strong>of</strong><br />
strong economic growth between 2000 and 2006.<br />
Table 14: CBD employment trends 1996-2009 19<br />
Source 1996 2000/<br />
2001<br />
2006 2009 Average<br />
annual<br />
growth<br />
percentage<br />
Statistics NZ Census (total<br />
workforce)<br />
Price Waterhouse Coopers<br />
Waterfront Study (Full Time<br />
Equivalents)<br />
<strong>Business</strong> <strong>Case</strong>, Appendix K<br />
(total employment)<br />
<strong>Auckland</strong> <strong>City</strong> Council<br />
(employment)<br />
50,907 50,823 60,075 1.7<br />
82,677 93,566 1.4<br />
71,170 81,200 1.5<br />
80,059 90,600 2.1<br />
The ARLTS forecasts for the CBD require an average annual growth rate <strong>of</strong> 1.9<br />
percent per annum (pa). This compares to a forecast growth rate <strong>of</strong> 1.5 percent pa<br />
for regional employment to 2041, and therefore requires the CBD to increase its<br />
share <strong>of</strong> employment from 12.3 percent (using ARLTS figures) to 14.1 percent. The<br />
ARLTS figures for the CBD can also be compared to a forecast by the former<br />
<strong>Auckland</strong> <strong>City</strong> Council. Their medium forecast predicted employment growth <strong>of</strong><br />
53,200 (from 90,600 in 2006 to 143,800 in 2041) which requires an average annual<br />
growth rate <strong>of</strong> 1.3 percent.<br />
The ARLTS figures for CBD employment growth seem slightly ambitious in light <strong>of</strong><br />
recent trends. However, they were used in the <strong>Review</strong> for modelling transport and<br />
WEBs to ensure consistency with other project appraisal and regional planning. The<br />
<strong>Review</strong>‘s key conclusion is that assumptions for additional CBD employment growth<br />
beyond the ARLTS forecasts require rates <strong>of</strong> growth that become increasingly<br />
19 There are significant differences in employment estimates for the CBD depending on the source. The <strong>Review</strong> has<br />
not attempted to resolve these differences, but they are likely to be explained, in part, by different employment<br />
definitions and survey areas.<br />
36
<strong>Auckland</strong> <strong>City</strong> <strong>Centre</strong> <strong>Rail</strong> <strong>Link</strong> <strong>Business</strong> <strong>Case</strong> <strong>Review</strong> | May 2011<br />
challenging in light <strong>of</strong> recent trends and forecasts for employment growth in the CBD<br />
and across <strong>Auckland</strong>.<br />
1.4.2 Employment location change as a result <strong>of</strong> the CCRL<br />
Employment and location decisions (by businesses) depend on a range <strong>of</strong> factors <strong>of</strong><br />
which travel costs including time is just one 20 . There is no established and widely<br />
accepted method either in New Zealand or internationally for estimating job<br />
relocation impacts from transport projects. <strong>Auckland</strong> Council <strong>of</strong>ficers consider the link<br />
between infrastructure investment and employment relocation is well understood<br />
conceptually, but has not been properly evaluated within the <strong>Business</strong> <strong>Case</strong>.<br />
The <strong>Business</strong> <strong>Case</strong> estimated that the CCRL would result in an additional 22,000<br />
jobs in the <strong>Auckland</strong> CBD above the ARLTS forecasts. This figure was calculated<br />
using the ARLTS employment forecast as a base and adjusting the <strong>Auckland</strong> <strong>City</strong><br />
Council medium forecast so that the forecast increase in employment started earlier.<br />
The additional jobs estimate was informed by United States <strong>of</strong> America case studies<br />
that were selected for their comparability to <strong>Auckland</strong>.<br />
The <strong>Business</strong> <strong>Case</strong> estimate would require an average annual increase in CBD<br />
employment <strong>of</strong> 2.3 percent.<br />
<strong>Auckland</strong> Council <strong>of</strong>ficers reviewed the employment assumptions and had the<br />
following concerns.<br />
The projections use different measures <strong>of</strong> employment and therefore, cannot be<br />
accurately compared.<br />
The projections relate to different geographic areas, which do not appear to be<br />
adjusted for, potentially removing a large share <strong>of</strong> the apparent impact <strong>of</strong> the rail<br />
project.<br />
The projections do not appear to have been normalised 21 as claimed in the<br />
<strong>Business</strong> <strong>Case</strong>.<br />
SDG reviewed the basis for the estimate and recommended that:<br />
“…unless further supporting evidence <strong>of</strong> the relevance <strong>of</strong> the case studies and the<br />
use and modification <strong>of</strong> the employment projections can be made available, that the<br />
employment impacts are based on unmodified and recognised forecasts.”<br />
The <strong>Review</strong> concluded that there were flaws with the <strong>Business</strong> <strong>Case</strong> approach taken<br />
to estimate additional jobs directly attributable to the CCRL. The Working Group then<br />
considered different assumptions or methodologies that could be used for estimating<br />
job growth.<br />
1.4.3 Alternative approaches for estimating employment change<br />
While there is no widely accepted approach to identifying the employment effects <strong>of</strong> a<br />
project, one recognised method is to run an integrated transport and land use model.<br />
These models are designed to show the effects <strong>of</strong> a range <strong>of</strong> variables, including<br />
transport projects, on land use, and vice versa. <strong>Auckland</strong>‘s integrated transport and<br />
land use model was run to estimate the employment effect <strong>of</strong> the CCRL. The model<br />
output indicated that the CCRL would result in an increase in the rate <strong>of</strong> jobs locating<br />
20 See for example – Cole (2005) ‗Location criteria – the position <strong>of</strong> transport.‘ in Applied Transport Economics –<br />
Policy, Management and Decision Making (pp.421-426).<br />
21 This means that the projections have been adjusted using an index as a means <strong>of</strong> comparison to account for<br />
differences in bases and areas.<br />
37
<strong>Auckland</strong> <strong>City</strong> <strong>Centre</strong> <strong>Rail</strong> <strong>Link</strong> <strong>Business</strong> <strong>Case</strong> <strong>Review</strong> | May 2011<br />
in the CBD for a period after construction, although this trend eventually reverses.<br />
The net impact <strong>of</strong> the tunnel is an additional 41 jobs located in the CBD in 2041.<br />
<strong>Auckland</strong> Council and <strong>Auckland</strong> Transport expressed reservations about use <strong>of</strong> the<br />
model, noting that the effects <strong>of</strong> employment <strong>of</strong> even very large transport projects are<br />
dominated by other factors such as changes in employment type and available area<br />
for development. This is in part due to the model structure and the fact that the region<br />
is generally reasonably well connected, particularly by roads.<br />
After reviewing the <strong>Business</strong> <strong>Case</strong> and the literature, including the integrated model<br />
run, central government agencies consider that the international evidence shows<br />
there are examples <strong>of</strong> rail projects supporting employment location in CBD areas.<br />
However, there is little or no evidence to show that there will be significant new<br />
<strong>Auckland</strong> CBD job growth over and above the level estimated in the ARLTS.<br />
Improvements in accessibility provided by the project could nevertheless enable<br />
businesses and employees to locate in the CBD rather than elsewhere in the region.<br />
Consequently, the upper bound 22 level <strong>of</strong> job relocation into the CBD occurring<br />
directly as a result <strong>of</strong> the project is likely to be in the vicinity <strong>of</strong> the morning peak<br />
patronage, or around 5,000 <strong>of</strong> the 58,000 jobs forecast by the 2010 ARLTS. This is<br />
significantly in excess <strong>of</strong> the model forecast results.<br />
<strong>Auckland</strong> Council <strong>of</strong>ficers consider that the project is likely to result in significant<br />
additional jobs above the ARLTS forecasts. Given the absence <strong>of</strong> a robust<br />
methodology for estimating additional jobs, the <strong>Auckland</strong> Council /<strong>Auckland</strong><br />
Transport policy case presented a low growth (5,000 jobs) and a high growth (20,000<br />
jobs) scenario.<br />
Given the absence <strong>of</strong> empirical evidence for job growth, the Working Group agreed<br />
to identify the potential job relocation benefits for a range <strong>of</strong> potential scenarios <strong>of</strong> job<br />
growth (5,000-20,000 jobs) as sensitivity tests.<br />
1.5 Urban regeneration benefits in the <strong>Business</strong> <strong>Case</strong><br />
The <strong>Business</strong> <strong>Case</strong> calculated WEBs (called urban regeneration benefits in the<br />
<strong>Business</strong> <strong>Case</strong>) by applying the estimated productivity premium for the <strong>Auckland</strong><br />
CBD <strong>of</strong> $29,943 23 to each job. When multiplied by the 22,000 additional jobs, the<br />
<strong>Business</strong> <strong>Case</strong> estimated net urban regeneration benefits <strong>of</strong> $3,333 million (Net<br />
Present Value).<br />
1.5.1 Productivity premium <strong>of</strong> CBD jobs<br />
Drawing on advice from SDG and an assessment from <strong>Auckland</strong> Council, the <strong>Review</strong><br />
considered the productivity premium used in the <strong>Business</strong> <strong>Case</strong> and concluded:<br />
the assessment did not correct for differences in sectoral composition, workforce<br />
quality and capital intensity between the CBD and the rest <strong>of</strong> <strong>Auckland</strong> <strong>City</strong> —<br />
overestimating the impacts by more than 100 percent<br />
no allowance for productivity growth is made when projecting the productivity<br />
differential over time, which causes an underestimation <strong>of</strong> about 23 percent<br />
the assessment fails to take account <strong>of</strong> workers‘ perceived cost <strong>of</strong> taking up jobs<br />
in the CBD, which causes an overestimate <strong>of</strong> 200 percent<br />
22 A proportion <strong>of</strong> the additional patronage will be as a result <strong>of</strong> change from other modes, and will be taken up by<br />
non-work trips, for example by students.<br />
23 Maré ( 2008) "Labour Productivity in <strong>Auckland</strong> Firms," MED Occasional Paper 08/09, <strong>Ministry</strong> <strong>of</strong> Economic<br />
Development, Wellington<br />
38
<strong>Auckland</strong> <strong>City</strong> <strong>Centre</strong> <strong>Rail</strong> <strong>Link</strong> <strong>Business</strong> <strong>Case</strong> <strong>Review</strong> | May 2011<br />
the <strong>Business</strong> <strong>Case</strong> used the CBD productivity premium compared to <strong>Auckland</strong>,<br />
whereas it should use the CBD productivity premium compared to the rest <strong>of</strong><br />
<strong>Auckland</strong> — this would increase the productivity differential<br />
Based on SDG advice, the <strong>Review</strong> concluded that only the tax take (the ‗tax wedge‘)<br />
from the increased productivity would be additional to benefits already implicitly<br />
accounted for in the conventional transport benefits. <strong>Auckland</strong> Council <strong>of</strong>ficers think<br />
the benefit is more than the tax wedge as outlined in section 1.8.3.<br />
The above <strong>Review</strong> conclusions were applied in the calculation <strong>of</strong> job relocation<br />
benefits outlined below.<br />
1.6 Calculation <strong>of</strong> other wider economic benefits<br />
The Working Group agreed to calculate the following WEBs in accordance with<br />
SDG‘s proposed methodology prepared for the NZTA for inclusion in the EEM:<br />
benefits from imperfect competition<br />
benefits from increased labour supply<br />
job relocation benefits<br />
SDG advised that imperfect competition benefits should be calculated as a proportion<br />
<strong>of</strong> the conventional benefits (2.5 percent based on the draft NZTA methodology and<br />
model outputs provided), due to the absence <strong>of</strong> more detailed data. This amounts to<br />
an imperfect competition benefit <strong>of</strong> $10 million.<br />
Labour supply benefits are calculated using the labour supply response to transport<br />
model estimates <strong>of</strong> commuter journey cost savings (i.e. the increase in people<br />
working due to improvements in accessibility). Model outputs were only available for<br />
2041, therefore SDG advised that the most appropriate estimate for labour supply is<br />
4.8 percent <strong>of</strong> conventional transport benefits. This amounts to a labour supply<br />
benefit <strong>of</strong> $19 million.<br />
Job relocation benefits (net productivity benefits) require estimation <strong>of</strong> change in<br />
employment relocation as a result <strong>of</strong> the project and the productivity differential<br />
arising from this change in location. To simplify the assessment, the <strong>Review</strong><br />
assumed that all job relocation as a result <strong>of</strong> the project would occur from outside the<br />
isthmus into the CBD, which gives the largest productivity increase. SDG estimated<br />
the real annual productivity differential (accounting for industry composition and other<br />
factors) for the <strong>Auckland</strong> CBD, in comparison to the rest <strong>of</strong> New Zealand, to be<br />
$20,107. The differential for the <strong>Auckland</strong> region, outside <strong>of</strong> the CBD and isthmus,<br />
was estimated as $7,091. This gives an annual net impact on productivity from the<br />
relocation <strong>of</strong> a job from the <strong>Auckland</strong> region area to the CBD <strong>of</strong> $13,016. The WEBs<br />
from job relocation is the tax take <strong>of</strong> 32 percent on the increased productivity. This<br />
amounts to around $4,200 in annual benefit per relocated job.<br />
Using this estimate, the 5,000–20,000 job range agreed as sensitivity tests by the<br />
Working Group provides job relocation benefits <strong>of</strong> $148 million to $591 million. The<br />
<strong>Review</strong> uses $148 million based on the assumption that 5,000 jobs would relocate<br />
into the CBD from outside <strong>of</strong> the isthmus by 2041 as a result <strong>of</strong> the CCRL.<br />
39
<strong>Auckland</strong> <strong>City</strong> <strong>Centre</strong> <strong>Rail</strong> <strong>Link</strong> <strong>Business</strong> <strong>Case</strong> <strong>Review</strong> | May 2011<br />
Table 15: <strong>Business</strong> <strong>Case</strong> and <strong>Review</strong> wider economic benefits<br />
Benefit category<br />
<strong>Business</strong> <strong>Case</strong> estimate<br />
($ million)<br />
Central government<br />
alternative estimates<br />
(calculated by SDG)<br />
($million)<br />
Imperfect competition<br />
Labour supply<br />
Net value added from CBD<br />
productivity gains<br />
Total wider economic<br />
benefits (beyond the<br />
EEM)<br />
Not estimated in <strong>Business</strong><br />
<strong>Case</strong><br />
Not estimated in <strong>Business</strong><br />
<strong>Case</strong><br />
10<br />
19<br />
3,333 148<br />
3,333 177<br />
1.7 Comparison with international projects<br />
Table 16, provided by SDG, provides a comparison <strong>of</strong> the WEBs from various urban<br />
rail projects as a proportion <strong>of</strong> conventional transport benefits. Agglomeration<br />
benefits for urban rail ranged from 14 percent to 33 percent <strong>of</strong> conventional transport<br />
benefits. Total additional WEBs ranged from 16 to 56 percent.<br />
The only projects for which job relocation benefits have been calculated are London‘s<br />
Crossrail and the two Melbourne projects in the table below (* refers).<br />
Crossrail, a £16 billion project was estimated to result in between 26,000 and 30,000<br />
jobs. Labour supply and job relocation was equivalent to 28 percent <strong>of</strong> conventional<br />
transport benefits. By comparison, the <strong>Business</strong> <strong>Case</strong> estimated urban regeneration<br />
benefits at 250 percent <strong>of</strong> conventional transport benefits. The <strong>Review</strong>, meanwhile,<br />
has estimated job relocation WEBs as 38 percent <strong>of</strong> transport benefits, while total<br />
WEBs are 71 percent.<br />
40
<strong>Auckland</strong> <strong>City</strong> <strong>Centre</strong> <strong>Rail</strong> <strong>Link</strong> <strong>Business</strong> <strong>Case</strong> <strong>Review</strong> | May 2011<br />
Table 16: Wider economic benefits from other urban rail projects as a percentage <strong>of</strong><br />
conventional benefits<br />
Type <strong>of</strong><br />
scheme<br />
Scheme Agglomeration Imperfect<br />
competition<br />
Labour<br />
market<br />
Total<br />
additional<br />
<strong>Rail</strong> Crossrail, London 24% 4% 28%* 56%<br />
Light<br />
<strong>Rail</strong><br />
Light<br />
<strong>Rail</strong><br />
Tees Valley Metro –<br />
Line B, North East<br />
England<br />
Cross River Tram,<br />
London<br />
33% 5% -5% 33%<br />
29% 1% 3% 33%<br />
Mixed<br />
Melbourne East<br />
West Road and <strong>Rail</strong><br />
package<br />
22% 2% 6%* 30%<br />
<strong>Rail</strong> AirTrack, London 26% 2% 1% 29%<br />
Light<br />
<strong>Rail</strong><br />
Croxley, London 25% 1% 2% 28%<br />
Light<br />
<strong>Rail</strong><br />
<strong>Rail</strong><br />
<strong>Rail</strong><br />
Tees Valley Metro –<br />
Line A, North East<br />
England<br />
Cross River <strong>Rail</strong>,<br />
Brisbane<br />
Melbourne East<br />
West <strong>Rail</strong> package<br />
23% 3% 1% 27%<br />
14% 0% 5% 19%<br />
14% 1% 2%* 16%<br />
1.8 <strong>Auckland</strong> Council views on Wider Economic Benefits<br />
<strong>Auckland</strong> Council <strong>of</strong>ficers agree with much <strong>of</strong> the work undertaken as part <strong>of</strong> the<br />
<strong>Review</strong> <strong>of</strong> the analysis <strong>of</strong> WEBs in the <strong>Business</strong> <strong>Case</strong> for the CCRL, but have<br />
presented alternative views in five key areas.<br />
CBD employment effects <strong>of</strong> the CCRL (refer to Appendix F, section 1.4.3).<br />
<strong>Auckland</strong> Council / <strong>Auckland</strong> Transport policy case (refer to Appendix E and<br />
Appendix F, section 1.8.4).<br />
faster regional economic growth as a result <strong>of</strong> the CCRL.<br />
Applicability <strong>of</strong> CGE analysis.<br />
Use <strong>of</strong> the tax wedge in estimating benefits from the CBD productivity differential.<br />
This section sets out <strong>Auckland</strong> Council‘s views on regional economic growth, CGE<br />
analysis and overall WEBs from the project.<br />
1.8.1 <strong>Review</strong> <strong>of</strong> faster regional growth from the CCRL<br />
A key issue raised by <strong>Auckland</strong> Council <strong>of</strong>ficers in the <strong>Review</strong> is that the <strong>Business</strong><br />
<strong>Case</strong> does not capture the impacts <strong>of</strong> faster regional growth and/or an increase in the<br />
size <strong>of</strong> the regional economy. This section outlines the <strong>Auckland</strong> Council <strong>of</strong>ficers‘<br />
rationale for this view.<br />
Investment in major transport infrastructure drives changes in land use and activity<br />
patterns, which generally increases the efficiency <strong>of</strong> a city‘s spatial economic<br />
41
<strong>Auckland</strong> <strong>City</strong> <strong>Centre</strong> <strong>Rail</strong> <strong>Link</strong> <strong>Business</strong> <strong>Case</strong> <strong>Review</strong> | May 2011<br />
structure. This results in faster economic growth, increasing the size <strong>of</strong> the regional<br />
economy. This effect is discussed in regards to projects <strong>of</strong> comparable size and<br />
significance in the report Roads <strong>of</strong> National Significance Economic Assessments<br />
<strong>Review</strong> prepared by SAHA for the NZTA noting that roads contribute directly to<br />
economic growth. The Additional Waitemata Harbour Crossing Preliminary <strong>Business</strong><br />
<strong>Case</strong> shows that even small increases in the size <strong>of</strong> the regional economy from<br />
transport infrastructure can have significant effects in relation to the benefits <strong>of</strong> a<br />
project. Importantly, the calculation <strong>of</strong> all other benefits would be applied across a<br />
larger base with respect to both the agglomeration and increased productivity effects.<br />
Conventional market analysis does not capture these effects and an increase in the<br />
size <strong>of</strong> the regional economy, in our view, has not been captured in the rail loop<br />
business case. We agree with the statements made by several leading economic<br />
consultancies (including Infometrics, NZIER 24 and Market Economics) that economic<br />
assessment <strong>of</strong> major transport or other infrastructure need to take into account the<br />
likely effects on the size and growth rate <strong>of</strong> the economy. Otherwise, the effects are<br />
likely to be under-stated, because direct transport effects, agglomeration effects and<br />
productivity gains will be calculated using estimates <strong>of</strong> the business sector, labour<br />
force and population, which underestimate the likely outcomes.<br />
This is important for major projects such as the CCRL with region-wide benefits,<br />
because a significant share <strong>of</strong> the economic benefit is likely to arise because the<br />
economy as a whole benefits (grows faster) from efficiency gains. Conversely,<br />
excluding the economy-wide effects will almost certainly act to understate effects<br />
(benefits and costs) for the economic evaluation. Where a project is being evaluated<br />
using a standard BCR approach, then the BCR is likely to be correspondingly understated.<br />
There has been no allowance for the additional benefits and costs associated with<br />
the larger economy in the economic assessments for the CCRL, which would appear<br />
a significant omission. Therefore, <strong>Auckland</strong> Council <strong>of</strong>ficers believe the BCR is<br />
understated.<br />
The following points help to set this in context for the CCRL.<br />
i. The <strong>Business</strong> <strong>Case</strong> identified transport benefits <strong>of</strong> $1.319 billion over 30 years<br />
(at an eight percent discount rate), and wider benefits (mainly agglomeration) <strong>of</strong><br />
$0.184 billion, totalling $1.503 billion.<br />
ii.<br />
iii.<br />
By 2021 (first year <strong>of</strong> rail operation) the <strong>Auckland</strong> economy would be around<br />
$71 billion (VA). If the project generated an increase <strong>of</strong> 0.36 percent in the<br />
<strong>Auckland</strong> economy 25 , this would amount to around $1.3 billion in NPV terms<br />
(same period, same discount rate, excluding the direct construction impact).<br />
If a component 26 <strong>of</strong> this economy-wide effect were acknowledged, then it would<br />
materially alter the BCR calculation. This is not to equate value added and<br />
benefit, but to recognise that relatively small percentage effects across a large<br />
economy for an extended time period may be significant in relation to the<br />
project, and that some share <strong>of</strong> such effects does constitute a ‗benefit‘.<br />
24 NZIER, 2011: Reprioritising infrastructure projects, NZIER Insight 26, 8 March 2011.<br />
25<br />
Based on the indicative figure in the AWHC study.<br />
26 Value added does not equate to benefit, though benefit is a component <strong>of</strong> value added.<br />
The prospect <strong>of</strong> effects across the economy appears to be one key reason for distinguishing<br />
and prioritizing RoNS relative to other projects.<br />
42
<strong>Auckland</strong> <strong>City</strong> <strong>Centre</strong> <strong>Rail</strong> <strong>Link</strong> <strong>Business</strong> <strong>Case</strong> <strong>Review</strong> | May 2011<br />
Accordingly, for accurate economic assessment <strong>of</strong> major projects it is very important<br />
to consider:<br />
whether the project is <strong>of</strong> such scale that it is likely to affect the size and rate <strong>of</strong><br />
growth <strong>of</strong> the (regional) economy overall<br />
if so, the likely extent <strong>of</strong> such effect, especially in relation to the more direct effects<br />
(transportation, agglomeration, productivity)<br />
1.8.2 Applicability <strong>of</strong> a computable general equilibrium analysis<br />
<strong>Auckland</strong> Council <strong>of</strong>ficers have proposed using a computable general equilibrium<br />
(CGE) model to estimate the regional economic effects and/or estimate employment<br />
change as a result <strong>of</strong> the CCRL in a more robust way. <strong>Auckland</strong> Council intends to<br />
undertake further work on considering running a CGE model<br />
The CGE modelling provides an ability to understand the pervasive nature <strong>of</strong> major<br />
transport infrastructure, and the likely regional growth effects. This is not possible<br />
using the integrated transport and land use model because this model does not have<br />
dynamic feedback loops to show economy-wide effects.<br />
Intuitively <strong>Auckland</strong> Council <strong>of</strong>ficers would expect that the greater efficiency observed<br />
in the transport industry would flow into the productive firms which would result in<br />
greater exports and economic growth domestically. This would generate additional<br />
pr<strong>of</strong>its and salaries, which would induce greater domestic demand.<br />
This is quite critical, because the scale <strong>of</strong> effects including travel cost benefits,<br />
agglomeration benefits, and productivity differentials need to be applied to the<br />
appropriate total level <strong>of</strong> activity within the economy. If the location and sectorspecific<br />
effects such as agglomeration benefits are applied to sectors which are too<br />
small or too large, then the overall results may be distorted.<br />
Three <strong>of</strong> the main private sector economic consultancies (Infometrics, NZIER, and<br />
Market Economics) are also <strong>of</strong> the view that economy-wide effects are important, and<br />
need to be taken into account in project evaluation. CGE provides a mechanism to<br />
do this. A major recent study undertaken by Infometrics included considering CGE<br />
modelling for the Roads <strong>of</strong> National Significance (RoNS) and indicated that RoNS<br />
were capable <strong>of</strong> generating considerably greater benefit (+80 percent) than that<br />
identified from conventional analysis. It follows that CGE modelling is a relevant<br />
alternative tool for assessing major transport projects, especially because it can help<br />
identify the effects on the economy as a whole.<br />
1.8.3 Use <strong>of</strong> the tax wedge<br />
SDG argue that within the productivity differential, only the tax wedge (approximately<br />
32 percent) can be included as a result <strong>of</strong> income increases. This is due to the<br />
perceived costs (to firms and workers) <strong>of</strong> relocating to the CBD equating to the<br />
increase in net income from being located in the CBD, otherwise they would already<br />
locate there.<br />
However, this issue needs to be considered within the context <strong>of</strong> firms relocating,<br />
rather than just employment relocation. For SDG‘s approach to hold true, the<br />
following two points must hold true.<br />
1. The firm needs to currently have the ability to locate into the CBD, but choose not<br />
to.<br />
2. The market environment to stay constant, and not be altered by any action by<br />
others to shift to/expand in the CBD (in other words, the marginal effect on the<br />
43
<strong>Auckland</strong> <strong>City</strong> <strong>Centre</strong> <strong>Rail</strong> <strong>Link</strong> <strong>Business</strong> <strong>Case</strong> <strong>Review</strong> | May 2011<br />
first affected firm equals the average effect across all firms, and there will be no<br />
consequent impacts from re-location on market conditions).<br />
<strong>Auckland</strong> Council <strong>of</strong>ficers consider it is unlikely that either would hold. Rather,<br />
<strong>of</strong>ficers would expect individual and cumulative location changes to affect the<br />
marketplace. In turn, these changes would be likely to generate other benefits to<br />
firms from re-location to the CBD, which are over and above the net changes in<br />
transport costs 27 . Therefore, a larger share (than just the tax wedge) should be<br />
included as a benefit.<br />
1.8.4 <strong>Auckland</strong> Council/<strong>Auckland</strong> Transport views on overall wider economic<br />
benefits<br />
As discussed in Appendix E, <strong>Auckland</strong> Council and <strong>Auckland</strong> Transport have<br />
presented a policy case that sets out their view on transport benefits. WEBs are<br />
calculated as a percentage <strong>of</strong> these benefits and also vary according to job growth<br />
assumptions. The table below provides the WEBs estimates for the low (5,000 jobs)<br />
and high (20,000 jobs) <strong>Auckland</strong> Council/<strong>Auckland</strong> Transport policy case scenarios.<br />
<strong>Auckland</strong> Council and <strong>Auckland</strong> Transport <strong>of</strong>ficers have also estimated that the<br />
project could generate additional regional economic growth. They estimate this could<br />
result in up to $1,300 million in additional benefits but note that only a component <strong>of</strong><br />
this number is additive to other benefits. The impact on the total WEBs on the policy<br />
case is shown in the table below.<br />
Table 17: <strong>Auckland</strong> Council and <strong>Auckland</strong> Transport estimation <strong>of</strong> wider economic benefits<br />
Benefit category<br />
Low growth scenario High growth scenario<br />
(5,000 jobs) ($M, NPV) (20,000 jobs) ($M, NPV)<br />
Agglomeration benefits 393 455<br />
Imperfect competition 30 34<br />
Labour supply 57 66<br />
Job relocation 148 591<br />
Total WEBs 628 1,146<br />
Increase in the size <strong>of</strong> the<br />
regional economy<br />
0-1,300 0-1,300<br />
Total including regional<br />
growth<br />
628-1,928 1,146-2,446<br />
1.9 Summary<br />
The Working Group has reviewed the analysis and estimation <strong>of</strong> WEBs in the<br />
<strong>Business</strong> <strong>Case</strong> for the CCRL. The <strong>Review</strong> concluded that while some WEBs were<br />
omitted, overall the <strong>Business</strong> <strong>Case</strong> WEBs were significantly overstated.<br />
The <strong>Review</strong> examined the <strong>Business</strong> <strong>Case</strong> estimate <strong>of</strong> 22,000 additional jobs as a<br />
result <strong>of</strong> the CCRL and concluded there were methodological issues with the<br />
<strong>Business</strong> <strong>Case</strong> approach. The <strong>Review</strong> concludes that up to 5,000 jobs could locate<br />
into the CBD, within the total forecast by the ARLTS, as a result <strong>of</strong> the project.<br />
<strong>Auckland</strong> Council and <strong>Auckland</strong> Transport <strong>of</strong>ficers consider:<br />
the job growth will be between 5,000 and 20,000 and that these will be jobs<br />
additional to the ARLTS forecasts<br />
27 <strong>Auckland</strong> Council has provided further detail explaining their argument in their memo <strong>of</strong> April 4<br />
44
<strong>Auckland</strong> <strong>City</strong> <strong>Centre</strong> <strong>Rail</strong> <strong>Link</strong> <strong>Business</strong> <strong>Case</strong> <strong>Review</strong> | May 2011<br />
that the <strong>Business</strong> <strong>Case</strong> and subsequent additional work has only partially<br />
captured the potential WEBs because it has not assessed the growth in the<br />
regional economy through efficiency gains in <strong>Auckland</strong>‘s spatial economic<br />
structure<br />
Central government <strong>of</strong>ficials have considered the <strong>Auckland</strong> Council <strong>of</strong>ficers‘ views, in<br />
light <strong>of</strong> best practice, and conclude that there a number <strong>of</strong> significant issues with the<br />
methodology and evidence basis that make it inappropriate to include these benefits<br />
in an economic assessment.<br />
The <strong>Review</strong> re-estimated WEBs for agglomeration, imperfect competition, labour<br />
supply and job relocation. The <strong>Review</strong> found, based on 5,000 jobs, the WEBs were<br />
$128 million for agglomeration and $177 million for the WEBs beyond the EEM (see<br />
table below).<br />
Table 18: CCRL wider economic benefits<br />
Benefit category<br />
<strong>Business</strong> <strong>Case</strong> estimate<br />
($m)<br />
<strong>Review</strong><br />
estimates($m)<br />
Agglomeration 185 (1) 128<br />
Imperfect competition (5)<br />
Not estimated in <strong>Business</strong><br />
<strong>Case</strong><br />
10 (2)<br />
Labour supply (6)<br />
Not estimated in <strong>Business</strong><br />
<strong>Case</strong><br />
19 (3)<br />
Productivity gains from job<br />
(7)<br />
relocation<br />
3,333 148(4)<br />
Total wider economic benefits 4,652 305<br />
Notes:<br />
(1) APB&B excluded agglomeration benefits from the total<br />
(2) 2.5% <strong>of</strong> conventional benefits<br />
(3) 4.8% <strong>of</strong> conventional benefits<br />
(4) Based on 5,000 jobs as a result <strong>of</strong> the project<br />
(5) This benefit category is not included in the current EEM<br />
(6) This benefit category is not included in the current EEM<br />
(7) This benefit category is not included in the current EEM<br />
45
<strong>Auckland</strong> <strong>City</strong> <strong>Centre</strong> <strong>Rail</strong> <strong>Link</strong> <strong>Business</strong> <strong>Case</strong> <strong>Review</strong> | May 2011<br />
Appendix G: Net cost/benefit<br />
1.1 Summary<br />
To compare projects and options, the various costs and benefits are identified each<br />
year over the modelling period. This stream <strong>of</strong> costs and benefits is then summed<br />
into a single net present value using a discount rate to reflect the ―interest effect‖<br />
where benefits and costs in the future are worth less to someone today (in other<br />
words, to be compensated for deferring a payment for a year, interest needs to be<br />
paid). The NZ Transport Agency material also sets out another related test, the<br />
benefit cost ratio (BCR) which uses the same data as the overall cost benefit analysis<br />
but presents it as a ratio which helps to identify relative priorities for projects,<br />
especially relevant when funding is tightly constrained.<br />
The <strong>Business</strong> <strong>Case</strong> prepared a range <strong>of</strong> cost benefit and BCR calculations and the<br />
methodology was assessed as part <strong>of</strong> this <strong>Review</strong>. The <strong>Review</strong> found that while<br />
there were minor irregularities in the approach, they did not have a significant effect<br />
on the BCR. The one point identified is the need to use the BCR (National) rather<br />
than a BCR (Government), as the latter subtracts revenues from costs with a<br />
consequential inflation on the apparent BCR. The table below sets out a summary <strong>of</strong><br />
the net present values calculated by the <strong>Review</strong>.<br />
46
<strong>Auckland</strong> <strong>City</strong> <strong>Centre</strong> <strong>Rail</strong> <strong>Link</strong> <strong>Business</strong> <strong>Case</strong> <strong>Review</strong> | May 2011<br />
Table 19: Summary <strong>of</strong> costs and benefits<br />
$ millions NPV, 8% discount<br />
rate (real, pre-tax)<br />
Transport Benefits<br />
<strong>Business</strong> <strong>Case</strong><br />
DoMin Tunnel Net<br />
<strong>Review</strong> estimates<br />
Benefits to new and existing users 1,660 2,302 642 214<br />
Decongestion benefits 1,770 2,447 677 173<br />
Bus cost savings 43<br />
Total transport benefits 1,319 430<br />
Wider Economic Benefits<br />
Agglomeration benefits 185 128<br />
Total benefits as per EEM 1,504<br />
Imperfect competition benefits - 10<br />
Increased labour tax benefits - 19<br />
Productivity benefits 3,333 148<br />
Total benefits 4,652 735<br />
Costs<br />
Capex tunnel 1,151 1,151<br />
Opex tunnel 36 59<br />
Infrastructure renewals 13 13<br />
Consequent costs 46 60<br />
Capex additional rolling stock 171 171<br />
Opex additional rolling stock 66 104<br />
Net property acquisition 141 141<br />
Bus cost savings -43 0<br />
Total costs 1,580 1,699<br />
Conventional Transport BCR 0.8 0.25<br />
BCR incl. wider economic benefits 2.9 0.43<br />
Revenue 237<br />
47
<strong>Auckland</strong> <strong>City</strong> <strong>Centre</strong> <strong>Rail</strong> <strong>Link</strong> <strong>Business</strong> <strong>Case</strong> <strong>Review</strong> | May 2011<br />
Figure 4: Central Government <strong>of</strong>ficials’ estimates for the overall costs and<br />
benefits <strong>of</strong> the rail tunnel<br />
1.2 Sensitivities<br />
A range <strong>of</strong> factors have been identified where either there is significant uncertainty,<br />
or where even relatively small changes could contribute to large responses/shifts in<br />
costs and benefits. Their impacts are summarised in the table below.<br />
Table 20: Key sensitivities<br />
Net<br />
Present<br />
Value<br />
($m)<br />
Benefit cost ratio<br />
<strong>Review</strong> assessment (incl WEBs) -$964 0.43<br />
Key sensitivities<br />
Change<br />
WEBs up by 100 percent 200 0.61<br />
Construction costs increase by 30 percent -$459 0.18<br />
S1: 2005 congestion factors and $30 parking charge -55 0.45<br />
S2: Higher annualisation for public transport benefits -10 0.48<br />
S3: Construction <strong>of</strong> Aotea station only -140 0.39<br />
S4: Fares increased by 10 percent -90 0.42<br />
S5: More rapid rail patronage growth, earlier -10 0.48<br />
S6: ARLTS 2010 congestion factors and higher parking charges 170 0.59<br />
48
<strong>Auckland</strong> <strong>City</strong> <strong>Centre</strong> <strong>Rail</strong> <strong>Link</strong> <strong>Business</strong> <strong>Case</strong> <strong>Review</strong> | May 2011<br />
Appendix H: Timing and what can be done to reduce future<br />
uncertainties<br />
Construction <strong>of</strong> the proposed tunnels and stations was estimated in the <strong>Business</strong><br />
<strong>Case</strong> to take around 6 years, following up to 4 years <strong>of</strong> preparatory work.<br />
The <strong>Business</strong> <strong>Case</strong> proposed that bringing the project forward so that it is built by<br />
2021 would enable <strong>Auckland</strong> to capitalise on the advantages it brings in terms <strong>of</strong>:<br />
providing alternative, complementary infrastructure to roads and relieving<br />
congestion<br />
opening up existing capacity in the rail network and providing for ongoing<br />
development <strong>of</strong> the bus network<br />
supporting the delivery <strong>of</strong> the region‘s land use strategies for densification<br />
and urbanisation around key centres<br />
Construction <strong>of</strong> the <strong>City</strong> <strong>Centre</strong> <strong>Rail</strong> <strong>Link</strong> (CCRL) by 2021 is also consistent with the<br />
2010 <strong>Auckland</strong> Regional Land Transport Strategy (ARLTS), which states that the<br />
project needs to be progressed with urgency and be operational by 2021.<br />
Building the CCRL by or before 2021 is a priority for <strong>Auckland</strong> Council and <strong>Auckland</strong><br />
Transport. The <strong>Auckland</strong> Transport view on timing is outlined below, followed by the<br />
<strong>Review</strong>‘s assessment.<br />
1.1 <strong>Auckland</strong> Council / <strong>Auckland</strong> Transport view<br />
1.1.1 <strong>Rail</strong> Service constraints<br />
The key constraint is Britomart‘s ability to handle peak volumes <strong>of</strong> trains and<br />
passengers. Britomart is constrained by its ability to accept 21 trains per hour, which<br />
will be close to being reached later in 2011 when the new 10-minute peak train<br />
service on the Western Line comes into operation.<br />
There is some debate around the timing <strong>of</strong> when the effective passenger volume<br />
constraint (as opposed to the train volume constraint) cuts in. At present, 5,019<br />
people 28 alight from 32 trains at Britomart between 7am and 9am on weekday<br />
mornings. A rough estimation <strong>of</strong> future capacity (using six-car EMUs and 21 trains<br />
per hour) provides a theoretical train passenger capacity <strong>of</strong> 27,720.<br />
Owing to the very long lead times for the implementation <strong>of</strong> the CCRL, there are<br />
significant risks around the under or overestimation <strong>of</strong> patronage and exactly when<br />
the passenger capacity constraint kicks in, which in turn creates uncertainty around<br />
the time when Britomart itself becomes a significant constraint. Note also that as the<br />
peak passenger load point lies outside Britomart for other than the Eastern Line, that<br />
other locations such as Newmarket may constrain network operation and capacity in<br />
advance <strong>of</strong> Britomart.<br />
There are options to help address the Britomart capacity constraint such as using<br />
pricing to manage demand in order to encourage less time-sensitive users to travel<br />
outside <strong>of</strong> the peak, and the ability to run different train service patterns, such as<br />
direct west to south services, that avoid the need to use Britomart altogether.<br />
28 Central Area Passenger Transport Survey, 9 September 2009, <strong>Auckland</strong> Regional Council Transport and Urban<br />
Development Committee.<br />
49
<strong>Auckland</strong> <strong>City</strong> <strong>Centre</strong> <strong>Rail</strong> <strong>Link</strong> <strong>Business</strong> <strong>Case</strong> <strong>Review</strong> | May 2011<br />
However, these are measures that will extract some limited additional capacity out <strong>of</strong><br />
the network rather than ones that will form an enduring solution to the capacity<br />
constraint itself.<br />
1.1.2 Bus service constraints<br />
While the <strong>Business</strong> <strong>Case</strong> discussed constraints around further development <strong>of</strong> the<br />
bus system in the central city, it did not consider external measures that might<br />
address some <strong>of</strong> the bus system issues in the central city, which might influence the<br />
timing <strong>of</strong> the CCRL. Such factors include:<br />
the absence, until the end <strong>of</strong> 2012, <strong>of</strong> integrated ticketing facilitating multimodal<br />
journeys<br />
the general absence <strong>of</strong> timed integration between bus and train services at<br />
key interchanges — this integration has been a practice <strong>of</strong> the Wellington<br />
public transport system for many years<br />
sub-optimal operations <strong>of</strong> the Britomart bus interchange which reduces its<br />
operational performance and does not optimise intermodal connectivity for<br />
customers<br />
the widespread distribution <strong>of</strong> bus terminal stops throughout the core CBD,<br />
making it difficult to transfer between many services<br />
relatively poor central area circulator services, especially to the fast-growing<br />
Wynyard Quarter — although <strong>Auckland</strong> Transport is planning to make<br />
significant progress in this area later in 2011<br />
conflict between different service groups in the same corridors, such as<br />
between northern and western bus services on Albert Street, which reduces<br />
the effectiveness <strong>of</strong> existing bus priority measures<br />
While these issues constitute a significant challenge to optimise bus operation in the<br />
central city, their resolution would mostly contribute to a rationalised and more<br />
integrated central area bus network, rather than one that would add major new<br />
capacity. This is due to the constraints <strong>of</strong> the existing street network, particularly on<br />
the eastern side <strong>of</strong> the city centre, the limited ability to add significant new bus priority<br />
measures across the city centre without unduly compromising its place function, and<br />
the need to appropriately balance the needs <strong>of</strong> all road user groups. Also <strong>of</strong> note is<br />
that the bulk <strong>of</strong> the central area bus network serves areas without rail, particularly the<br />
bulk <strong>of</strong> the <strong>Auckland</strong> Isthmus and the whole <strong>of</strong> the North Shore and the Hibiscus<br />
Coast.<br />
Any reduction in bus volumes by improving integration with rail would most likely be<br />
taken up by improved service frequencies from other areas.<br />
1.2 The <strong>Review</strong> position<br />
The government is currently undertaking a $1.1 billion programme to upgrade and<br />
electrify the <strong>Auckland</strong> metro rail network (alongside a further $500 million for new<br />
trains expected to be funded by the <strong>Auckland</strong> Council and NZ Transport Agency<br />
(NZTA), and ongoing <strong>Auckland</strong> Council and NZTA investment in rail stations). This<br />
will improve the frequency, speed, reliability and quality <strong>of</strong> rail services. The former<br />
<strong>Auckland</strong> Regional Transport Authority‘s <strong>Rail</strong> Development Plan notes that the<br />
investment in electrification will:<br />
reduce congestion, improving freight travel times and road user journey time<br />
reliability<br />
encourage intensification <strong>of</strong> development along rail corridors<br />
increase economic activity and labour productivity in the CBD<br />
50
<strong>Auckland</strong> <strong>City</strong> <strong>Centre</strong> <strong>Rail</strong> <strong>Link</strong> <strong>Business</strong> <strong>Case</strong> <strong>Review</strong> | May 2011<br />
The government is keen to see evidence <strong>of</strong> these results being achieved from its<br />
current investment in electrification.<br />
1.2.1 Capacity into the CBD, sequencing and prioritisation<br />
Patronage forecasts, covered in Appendix C, indicate that the majority <strong>of</strong> demand for<br />
access into the CBD will come from bus services. These forecasts suggest that the<br />
priority for investment in CBD access should be providing for continued growth <strong>of</strong> bus<br />
patronage (particularly through the Northern Busway), followed by ensuring the<br />
success <strong>of</strong> rail electrification and the CCRL.<br />
In practice, rail and bus modes are complementary and therefore capital and<br />
operational investment in these modes needs to be pursued together. This is<br />
primarily a matter for <strong>Auckland</strong> Council, <strong>Auckland</strong> Transport and the NZTA.<br />
However, central government agencies‘ view is that a robust and affordable,<br />
multimodal investment programme is required to provide an understanding <strong>of</strong> the<br />
entire picture <strong>of</strong> capacity provision for travel to, and within, the CBD. This needs to<br />
occur within the context <strong>of</strong> <strong>Auckland</strong>‘s spatial plan, the <strong>City</strong> <strong>Centre</strong> Masterplan and<br />
the Waterfront Development Plan. Development <strong>of</strong> this programme is necessary to<br />
clarify how the CCRL sits alongside other priorities for meeting demand for trips into<br />
the CBD.<br />
1.2.2 An alternative approach to timing: advantages and disadvantages<br />
Central government agencies‘ view is that it makes sense for <strong>Auckland</strong> Council to<br />
undertake route protection for the CCRL now and to re-examine funding for<br />
construction when progress against at least some <strong>of</strong> the following has been made.<br />
Finalisation and implementation <strong>of</strong> the <strong>Auckland</strong> spatial plan and <strong>City</strong> <strong>Centre</strong><br />
Masterplan to establish achievable growth projections for the CBD and to<br />
quantify where the growth projected for the CBD will occur.<br />
Demonstrating commitment to resolving current and emerging CBD access<br />
issues, for example by improving bus operations and addressing capacity<br />
issues.<br />
Development <strong>of</strong> a robust and achievable multimodal programme for transport<br />
in the CBD, which considers a thorough analysis <strong>of</strong> alternatives and identifies<br />
the optimal mix <strong>of</strong> modes to meet demand.<br />
Beginning implementation <strong>of</strong> large scale residential developments along the<br />
rail corridor.<br />
Implementation <strong>of</strong> additional park and ride sites and changes to bus feeder<br />
services where appropriate in terms <strong>of</strong> overall public transport demand.<br />
The implementation <strong>of</strong> these measures, combined with increased rail patronage<br />
above forecasts and a robust economic case, will provide a strong signal that the<br />
conditions are in place to drive the necessary benefits from the project and therefore<br />
to reconsider the case for the CCRL.<br />
The key disadvantage <strong>of</strong> making a later decision is that it will delay the onset <strong>of</strong> the<br />
benefits associated with the project, but this must be weighed against the<br />
advantages <strong>of</strong> delaying the costs. A later decision will also lead to some patronage<br />
loss from the rail capacity constraint, although this could be mitigated by alternative<br />
51
<strong>Auckland</strong> <strong>City</strong> <strong>Centre</strong> <strong>Rail</strong> <strong>Link</strong> <strong>Business</strong> <strong>Case</strong> <strong>Review</strong> | May 2011<br />
service patterns. However, the number <strong>of</strong> passengers lost to rail and the associated<br />
congestion costs are, on their own, insufficient to justify the costs <strong>of</strong> project<br />
construction now.<br />
1.3 Proceeding with a Notice <strong>of</strong> Requirement for the route<br />
Central government <strong>of</strong>ficials understand that the <strong>Business</strong> <strong>Case</strong> consultants have<br />
largely prepared the core evidence required to proceed with lodging a Notice <strong>of</strong><br />
Requirement for the route. The process to achieve designation is expected to take<br />
between 2 and 3 years, which suggests a designation could be in place by 2014.<br />
While Kiwi<strong>Rail</strong> would most likely be the designating authority, there are precedents<br />
for Kiwi<strong>Rail</strong> to operate closely with the relevant local authority which undertakes to<br />
meet the costs and liabilities involved (for example as in the Oakley to Marsden Point<br />
<strong>Rail</strong> <strong>Link</strong>, where Kiwi<strong>Rail</strong> has an agreement with the Northland Regional Council). If<br />
<strong>Auckland</strong> Council decides to proceed, it would reach agreement with Kiwi<strong>Rail</strong> to<br />
cover the costs involved both <strong>of</strong> obtaining the designation (which the <strong>Business</strong> <strong>Case</strong><br />
estimated at $5 million per annum) as well as the subsequent property purchase<br />
costs (which the <strong>Business</strong> <strong>Case</strong> estimates at a gross value in the order <strong>of</strong> $230<br />
million). More detail on the notice <strong>of</strong> requirement and property acquisition processes<br />
is provided on pages 104 to 107 <strong>of</strong> the <strong>Business</strong> <strong>Case</strong>.<br />
52
<strong>Auckland</strong> <strong>City</strong> <strong>Centre</strong> <strong>Rail</strong> <strong>Link</strong> <strong>Business</strong> <strong>Case</strong> <strong>Review</strong> | May 2011<br />
Glossary<br />
The <strong>Business</strong> <strong>Case</strong> – the business case prepared by APB&B for the <strong>Auckland</strong><br />
Regional Transport Authority and Kiwi<strong>Rail</strong><br />
The Working Group – the group <strong>of</strong> people who made up the review team<br />
The <strong>Review</strong> – the process undertaken (also refers to the central government<br />
agencies position)<br />
The base case – the set <strong>of</strong> assumptions used in calculating the benefits <strong>of</strong> the<br />
project used in the <strong>Review</strong><br />
The policy case – an alternative set <strong>of</strong> assumptions and resulting benefits prepared<br />
by <strong>Auckland</strong> Council/<strong>Auckland</strong> Transport<br />
The do minimum – the metro rail network post electrification<br />
The do something – the metro rail network including the CCRL<br />
The CCRL – the project as described in Appendix A, section1.2 Project description<br />
53


