Annual Report 2008-09.pdf - Higher Education Commission
Annual Report 2008-09.pdf - Higher Education Commission
Annual Report 2008-09.pdf - Higher Education Commission

You also want an ePaper? Increase the reach of your titles
YUMPU automatically turns print PDFs into web optimized ePapers that Google loves.
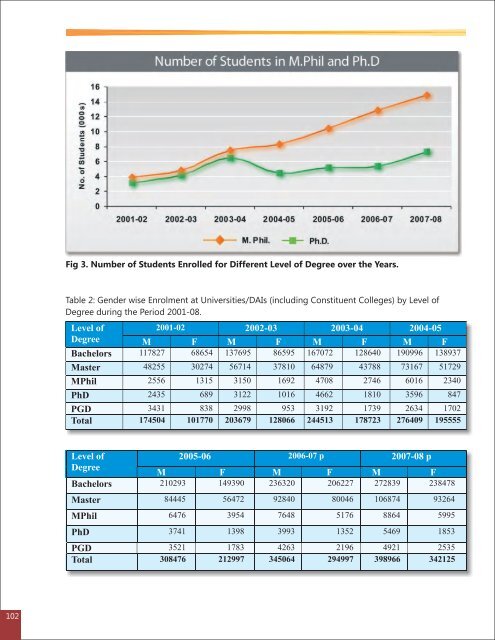
Fig 3. Number of Students Enrolled for Different Level of Degree over the Years.<br />
Table 2: Gender wise Enrolment at Universities/DAIs (including Constituent Colleges) by Level of<br />
Degree during the Period 2001-08.<br />
Level of<br />
2001-02 2002-03 2003-04 2004-05<br />
Degree M F M F M F M F<br />
Bachelors 117827 68654 137695 86595 167072 128640 190996 138937<br />
Master 48255 30274 56714 37810 64879 43788 73167 51729<br />
MPhil 2556 1315 3150 1692 4708 2746 6016 2340<br />
PhD 2435 689 3122 1016 4662 1810 3596 847<br />
PGD 3431 838 2998 953 3192 1739 2634 1702<br />
Total 174504 101770 203679 128066 244513 178723 276409 195555<br />
Level of<br />
2005-06 2006-07 p 2007-08 p<br />
Degree<br />
M F M F M F<br />
Bachelors 210293 149390 236320 206227 272839 238478<br />
Master 84445 56472 92840 80046 106874 93264<br />
MPhil 6476 3954 7648 5176 8864 5995<br />
PhD 3741 1398 3993 1352 5469 1853<br />
PGD 3521 1783 4263 2196 4921 2535<br />
Total 308476 212997 345064 294997 398966 342125<br />
102