Key Facts and Figures 0607 - Higher Education Authority
Key Facts and Figures 0607 - Higher Education Authority
Key Facts and Figures 0607 - Higher Education Authority

Create successful ePaper yourself
Turn your PDF publications into a flip-book with our unique Google optimized e-Paper software.
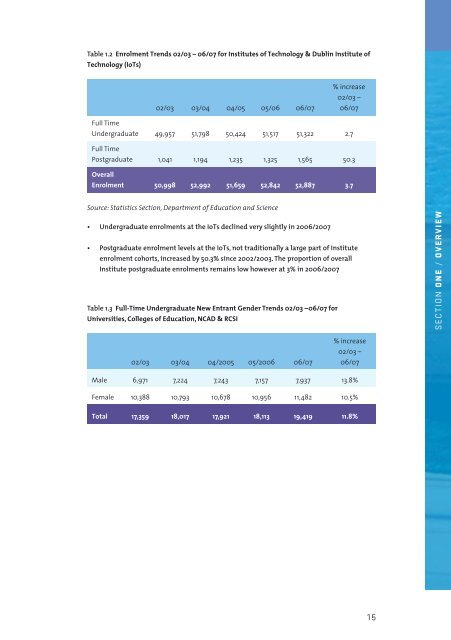
Table 1.2 Enrolment Trends 02/03 – 06/07 for Institutes of Technology & Dublin Institute of<br />
Technology (IoTs)<br />
02/03 03/04 04/05 05/06 06/07<br />
% increase<br />
02/03 –<br />
06/07<br />
Full Time<br />
Undergraduate 49,957 51,798 50,424 51,517 51,322 2.7<br />
Full Time<br />
Postgraduate 1,041 1,194 1,235 1,325 1,565 50.3<br />
Overall<br />
Enrolment 50,998 52,992 51,659 52,842 52,887 3.7<br />
Source: Statistics Section, Department of <strong>Education</strong> <strong>and</strong> Science<br />
Undergraduate enrolments at the IoTs declined very slightly in 2006/2007<br />
Postgraduate enrolment levels at the IoTs, not traditionally a large part of Institute<br />
enrolment cohorts, increased by 50.3% since 2002/2003. The proportion of overall<br />
Institute postgraduate enrolments remains low however at 3% in 2006/2007<br />
Table 1.3 Full-Time Undergraduate New Entrant Gender Trends 02/03 –06/07 for<br />
Universities, Colleges of <strong>Education</strong>, NCAD & RCSI<br />
SECTION ONE / OVERVIEW<br />
02/03 03/04 04/2005 05/2006 06/07<br />
% increase<br />
02/03 –<br />
06/07<br />
Male 6,971 7,224 7,243 7,157 7,937 13.8%<br />
Female 10,388 10,793 10,678 10,956 11,482 10.5%<br />
Total 17,359 18,017 17,921 18,113 19,419 11.8%<br />
15