Key Facts and Figures 0607 - Higher Education Authority
Key Facts and Figures 0607 - Higher Education Authority
Key Facts and Figures 0607 - Higher Education Authority

You also want an ePaper? Increase the reach of your titles
YUMPU automatically turns print PDFs into web optimized ePapers that Google loves.
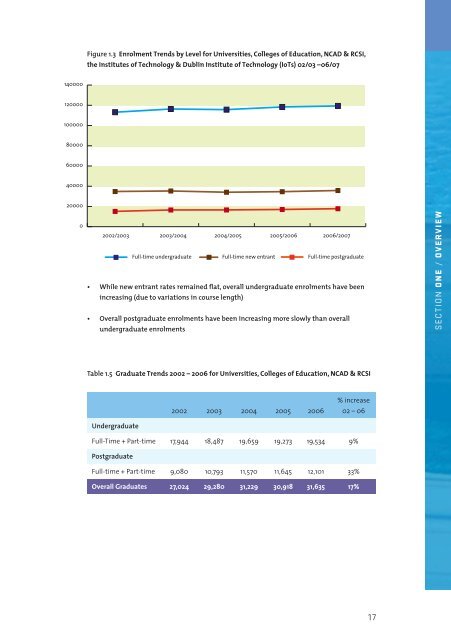
Figure 1.3 Enrolment Trends by Level for Universities, Colleges of <strong>Education</strong>, NCAD & RCSI,<br />
the Institutes of Technology & Dublin Institute of Technology (IoTs) 02/03 –06/07<br />
140000<br />
120000<br />
100000<br />
80000<br />
60000<br />
40000<br />
20000<br />
0<br />
<br />
<br />
2002/2003 2003/2004 2004/2005 2005/2006 2006/2007<br />
Full-time undergraduate Full-time new entrant Full-time postgraduate<br />
While new entrant rates remained flat, overall undergraduate enrolments have been<br />
increasing (due to variations in course length)<br />
Overall postgraduate enrolments have been increasing more slowly than overall<br />
undergraduate enrolments<br />
SECTION ONE / OVERVIEW<br />
Table 1.5 Graduate Trends 2002 – 2006 for Universities, Colleges of <strong>Education</strong>, NCAD & RCSI<br />
2002 2003 2004 2005 2006<br />
% increase<br />
02 – 06<br />
Undergraduate<br />
Full-Time + Part-time 17,944 18,487 19,659 19,273 19,534 9%<br />
Postgraduate<br />
Full-time + Part-time 9,080 10,793 11,570 11,645 12,101 33%<br />
Overall Graduates 27,024 29,280 31,229 30,918 31,635 17%<br />
17