Key Facts and Figures 0607 - Higher Education Authority
Key Facts and Figures 0607 - Higher Education Authority
Key Facts and Figures 0607 - Higher Education Authority
You also want an ePaper? Increase the reach of your titles
YUMPU automatically turns print PDFs into web optimized ePapers that Google loves.
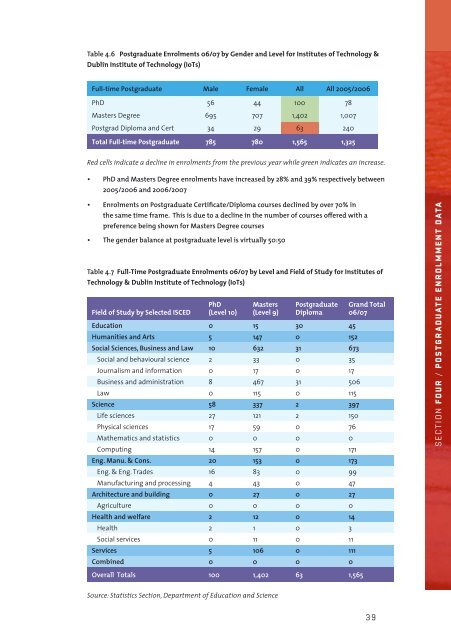
Table 4.6 Postgraduate Enrolments 06/07 by Gender <strong>and</strong> Level for Institutes of Technology &<br />
Dublin Institute of Technology (IoTs)<br />
Full-time Postgraduate Male Female All All 2005/2006<br />
PhD 56 44 100 78<br />
Masters Degree 695 707 1,402 1,007<br />
Postgrad Diploma <strong>and</strong> Cert 34 29 63 240<br />
Total Full-time Postgraduate 785 780 1,565 1,325<br />
Red cells indicate a decline in enrolments from the previous year while green indicates an increase.<br />
<br />
PhD <strong>and</strong> Masters Degree enrolments have increased by 28% <strong>and</strong> 39% respectively between<br />
2005/2006 <strong>and</strong> 2006/2007<br />
<br />
<br />
Enrolments on Postgraduate Certificate/Diploma courses declined by over 70% in<br />
the same time frame. This is due to a decline in the number of courses offered with a<br />
preference being shown for Masters Degree courses<br />
The gender balance at postgraduate level is virtually 50:50<br />
Table 4.7 Full-Time Postgraduate Enrolments 06/07 by Level <strong>and</strong> Field of Study for Institutes of<br />
Technology & Dublin Institute of Technology (IoTs)<br />
Field of Study by Selected ISCED<br />
PhD<br />
(Level 10)<br />
Masters<br />
(Level 9)<br />
Postgraduate<br />
Diploma<br />
<strong>Education</strong> 0 15 30 45<br />
Humanities <strong>and</strong> Arts 5 147 0 152<br />
Social Sciences, Business <strong>and</strong> Law 10 632 31 673<br />
Social <strong>and</strong> behavioural science 2 33 0 35<br />
Journalism <strong>and</strong> information 0 17 0 17<br />
Business <strong>and</strong> administration 8 467 31 506<br />
Law 0 115 0 115<br />
Science 58 337 2 397<br />
Life sciences 27 121 2 150<br />
Physical sciences 17 59 0 76<br />
Mathematics <strong>and</strong> statistics 0 0 0 0<br />
Computing 14 157 0 171<br />
Eng. Manu. & Cons. 20 153 0 173<br />
Eng. & Eng. Trades 16 83 0 99<br />
Manufacturing <strong>and</strong> processing 4 43 0 47<br />
Architecture <strong>and</strong> building 0 27 0 27<br />
Agriculture 0 0 0 0<br />
Health <strong>and</strong> welfare 2 12 0 14<br />
Health 2 1 0 3<br />
Social services 0 11 0 11<br />
Services 5 106 0 111<br />
Combined 0 0 0 0<br />
Gr<strong>and</strong> Total<br />
06/07<br />
SECTION FOUR / POSTGRADUATE ENROLMMENT DATA<br />
Overall Totals 100 1,402 63 1,565<br />
Source: Statistics Section, Department of <strong>Education</strong> <strong>and</strong> Science<br />
39


