Key Facts and Figures 0607 - Higher Education Authority
Key Facts and Figures 0607 - Higher Education Authority
Key Facts and Figures 0607 - Higher Education Authority

Create successful ePaper yourself
Turn your PDF publications into a flip-book with our unique Google optimized e-Paper software.
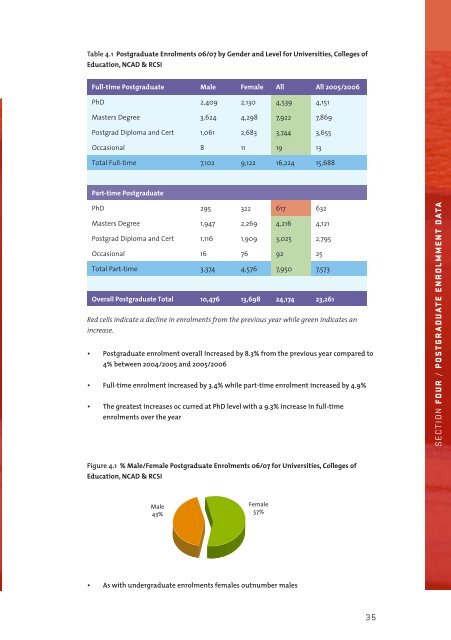
Table 4.1 Postgraduate Enrolments 06/07 by Gender <strong>and</strong> Level for Universities, Colleges of<br />
<strong>Education</strong>, NCAD & RCSI<br />
Full-time Postgraduate Male Female All All 2005/2006<br />
PhD 2,409 2,130 4,539 4,151<br />
Masters Degree 3,624 4,298 7,922 7,869<br />
Postgrad Diploma <strong>and</strong> Cert 1,061 2,683 3,744 3,655<br />
Occasional 8 11 19 13<br />
Total Full-time 7,102 9,122 16,224 15,688<br />
Part-time Postgraduate<br />
PhD 295 322 617 632<br />
Masters Degree 1,947 2,269 4,216 4,121<br />
Postgrad Diploma <strong>and</strong> Cert 1,116 1,909 3,025 2,795<br />
Occasional 16 76 92 25<br />
Total Part-time 3,374 4,576 7,950 7,573<br />
Overall Postgraduate Total 10,476 13,698 24,174 23,261<br />
Red cells indicate a decline in enrolments from the previous year while green indicates an<br />
increase.<br />
Postgraduate enrolment overall increased by 8.3% from the previous year compared to<br />
4% between 2004/2005 <strong>and</strong> 2005/2006<br />
Full-time enrolment increased by 3.4% while part-time enrolment increased by 4.9%<br />
The greatest increases oc curred at PhD level with a 9.3% increase in full-time<br />
enrolments over the year<br />
SECTION FOUR / POSTGRADUATE ENROLMMENT DATA<br />
Figure 4.1 % Male/Female Postgraduate Enrolments 06/07 for Universities, Colleges of<br />
<strong>Education</strong>, NCAD & RCSI<br />
Male<br />
43%<br />
Female<br />
57%<br />
<br />
As with undergraduate enrolments females outnumber males<br />
35