Complete issue 10:1 as one pdf - TUG
Complete issue 10:1 as one pdf - TUG
Complete issue 10:1 as one pdf - TUG

You also want an ePaper? Increase the reach of your titles
YUMPU automatically turns print PDFs into web optimized ePapers that Google loves.
42 <strong>TUG</strong>boat, Volume <strong>10</strong> (1989), No. 1<br />
Implementation Considerations<br />
Since normal rn output is ultimately onto r<strong>as</strong>ter<br />
scan devices, e.g., l<strong>as</strong>er printers and digital phototypesetters,<br />
the line drawing macros must implement<br />
Bresenham's line drawing algorithm (or a<br />
DDA) (see Ref. 3). PICI'EX, in fact, does this using<br />
the period <strong>as</strong> the plotting character. Although using<br />
the period <strong>as</strong> the plotting character achieves device<br />
independence, if variable line thickness is required,<br />
using only the period <strong>as</strong> the plotting character is<br />
not sufficient.<br />
Several alternate techniques suggest themselves.<br />
Two are menti<strong>one</strong>d here. The first is to use<br />
METAFONT to define graphic plotting characters,<br />
e.g., various sized dots, squares or diamonds from<br />
which various thickness lines can be constructed.<br />
The second is to directly define various size squares<br />
using \hrule or \vrule (Ref. 4 page 64) to use in<br />
constructing the various thickness lines. In either<br />
c<strong>as</strong>e the 'symbols' should be overlapped to decre<strong>as</strong>e<br />
ali<strong>as</strong>ing effects.<br />
Inclusion of photographs or continuous t<strong>one</strong><br />
images in requires dealing with pixels to digitally<br />
represent these pictures. Hence the \setpxl<br />
macro above. Pixels have varying intensity. Printers<br />
use a photographic screen process called halftoning<br />
to print continuous t<strong>one</strong> images. There are two<br />
principal digital analogs of this process: patterning<br />
and dither (see Refs. 3, 5 or 6). Patterning gives<br />
up spatial resolution to achieve intensity resolution.<br />
Dither introduces randomness into the digitized<br />
image to give the impression of multiple intensity<br />
(gray) levels without losing spatial resolution. Both,<br />
actually print only black 'dots' on 'white' paper.<br />
Both are e<strong>as</strong>ily extended to color.<br />
In patterning, elements of a small grid are<br />
either black or white. For example a 2 x 2 grid using<br />
a single dot size yields 5 intensity levels <strong>as</strong> shown<br />
here<br />
The fifth intensity is, of course, no dots.<br />
Multiple dot sizes can be used. With multiple<br />
dot sizes, the number of intensity levels is<br />
(width<br />
height of the grid)(the "umber of dot sizes +I)<br />
From this it is e<strong>as</strong>y to see that a 2 x 2 grid with 3 different<br />
dot sizes yields 256 different intensity (gray)<br />
levels. However, not all these patterns necessarily<br />
yield unique intensity levels. Monochrome images<br />
are quite adequately represented by 256 intensity<br />
(gray) levels. Note also that 256 is precisely the<br />
number in a new font. Thus, <strong>one</strong> method<br />
of generating these intensity levels is to create a<br />
special graphics font using METAFONT. One word<br />
of caution is in order: the number of 2 x 2 patterns<br />
depends on the available spatial resolution. For<br />
example, for a 2 x 2 pattern grid, an image digitized<br />
with 512 pixels across its width requires a minimum<br />
width on the page of a 300 dpi output device of<br />
3.41 inches. This <strong>as</strong>sumes that <strong>one</strong> physical output<br />
device dot is used for each horizontal grid location.<br />
Thus, only 5 intensity levels are available. Higher<br />
resolution output devices, e.g., phototypesetters,<br />
yield more intensity levels. Minimum acceptable<br />
output resolutions are <strong>10</strong>00-1200 dpi. Consequently,<br />
300 dpi l<strong>as</strong>er printers would be useful for<br />
proofing only. One additional subtlety should be<br />
menti<strong>one</strong>d. Unless the patterns are carefully selected,<br />
moirk <strong>as</strong> well <strong>as</strong> other undesirable patterns<br />
appear in the output.<br />
These can be minimized<br />
by randomly rotating the patterns 90, 180 and<br />
270 degrees. Unfortunately, unless a font rotation<br />
macro becomes available, this feature requires four<br />
different graphics fonts.<br />
Dither introduces controlled randomness into<br />
the digitized image to produce the impression of<br />
multiple gray levels. Intensity resolution is incre<strong>as</strong>ed<br />
without loss of spatial resolution. The algorithm is<br />
conceptually quite simple:<br />
for each scanline in the image<br />
for each pixel along the scanline<br />
determine the position in a dither matrix<br />
i = (x Mod n) + 1<br />
j = (y Mod n) + 1<br />
determine the pixel display value<br />
if image pixel intensity(x, y) <<br />
dither matrix(i, j) then<br />
write black pixel<br />
else<br />
write white pixel<br />
end if<br />
next pixel<br />
next scanline<br />
Details are given in Refs. 3 and 6. The number<br />
of apparent intensity levels depends on the dither<br />
matrix. Dither matrices are square. Their sizes<br />
typically incre<strong>as</strong>e by factors of 2, e.g., 2 x 2, 4 x4<br />
and 8 x 8. The number of apparent intensity levels<br />
is the dither matrix size squared, e.g., an 8 x 8<br />
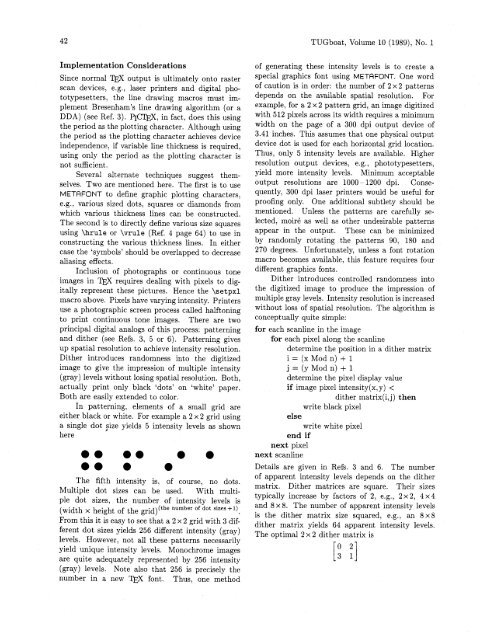
dither matrix yields 64 apparent intensity levels.<br />
The optimal 2 x 2 dither matrix is