Portfolios - EDHEC-Risk
Portfolios - EDHEC-Risk
Portfolios - EDHEC-Risk

Create successful ePaper yourself
Turn your PDF publications into a flip-book with our unique Google optimized e-Paper software.
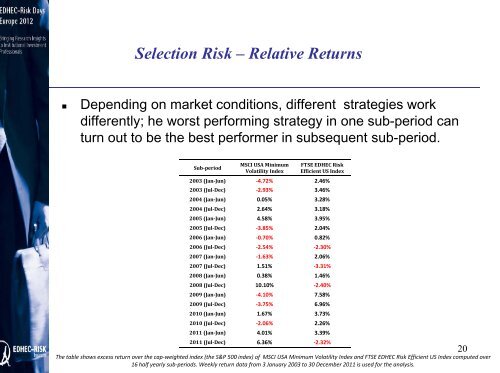
Selection <strong>Risk</strong> – Relative Returns<br />
• Depending on market conditions, different strategies work<br />
differently; he worst performing strategy in one sub-period can<br />
turn out to be the best performer in subsequent sub-period<br />
period.<br />
Subperiod<br />
MSCI USA Minimum<br />
Volatility Index<br />
FTSE <strong>EDHEC</strong> <strong>Risk</strong><br />
Efficient US Index<br />
2003 (JanJun) ‐4.72% 2.46%<br />
2003 (JulDec) ‐2.93% 3.46%<br />
2004 (JanJun) 0.05% 3.28%<br />
2004 (JulDec) 2.64% 3.18%<br />
2005 (JanJun) 4.58% 3.95%<br />
2005 (JulDec) ‐3.85% 2.04%<br />
2006 (JanJun) ‐0.70% 0.82%<br />
2006 (JulDec) ‐2.54% ‐2.30%<br />
2007 (JanJun) ‐1.63% 2.06%<br />
2007 (JulDec) 1.51% ‐3.31%<br />
2008 (JanJun) 0.38% 1.46%<br />
2008 (JulDec) 10.10% ‐2.40%<br />
2009 (JanJun) ‐4.10% 7.58%<br />
2009 (JulDec) ‐3.75% 6.96%<br />
2010 (JanJun) 1.67% 3.73%<br />
2010 (JulDec) ‐2.06% 2.26%<br />
2011 (JanJun) 4.01% 3.39%<br />
2011 (JulDec) 6.36% ‐2.32%<br />
The table shows excess return over the cap‐weighted index (the S&P 500 index) of MSCI USA Minimum Volatility Index and FTSE <strong>EDHEC</strong> <strong>Risk</strong> Efficient US Index computed over<br />
16 half yearly sub‐periods. Weekly return data from 3 January 2003 to 30 December 2011 is used for the analysis.<br />
20