Portfolios - EDHEC-Risk
Portfolios - EDHEC-Risk
Portfolios - EDHEC-Risk

You also want an ePaper? Increase the reach of your titles
YUMPU automatically turns print PDFs into web optimized ePapers that Google loves.
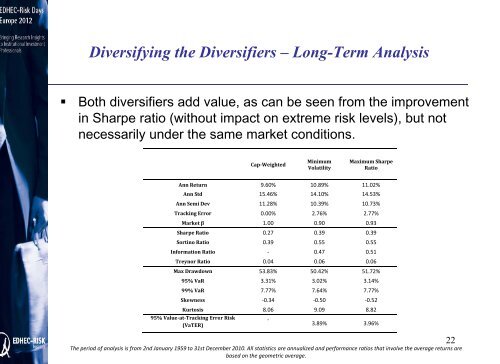
Diversifying the Diversifiers – Long-Term Analysis<br />
• Both diversifiers add value, as can be seen from the improvement<br />
in Sharpe ratio (without impact on extreme risk levels), but not<br />
necessarily under the same market conditions.<br />
CapWeighted<br />
Minimum<br />
Volatility<br />
Maximum Sharpe<br />
Ratio<br />
Ann Return 9.60% 10.89% 11.02%<br />
Ann Std 15.46% 14.10% 14.53%<br />
Ann Semi Dev 11.28% 10.39% 10.73%<br />
Tracking Error 0.00% 2.76% 2.77%<br />
Market β 1.00 0.90 0.93<br />
Sharpe Ratio 0.27 0.39 0.39<br />
Sortino Ratio 0.39 0.55 0.55<br />
Information Ratio ‐ 0.47 0.51<br />
Treynor Ratio 0.04 0.06 0.06<br />
Max Drawdown 53.83% 50.42% 51.72%<br />
95% VaR 3.31% 3.02% 3.14%<br />
99% VaR 7.77% 7.64% 7.77%<br />
Skewness ‐0.34 ‐0.50 ‐0.52<br />
Kurtosis 8.06 9.09 8.82<br />
95% ValueatTracking at Error <strong>Risk</strong><br />
(VaTER)<br />
‐<br />
3.89% 3.96%<br />
The period of analysis is from 2nd January 1959 to 31st December 2010. All statistics are annualized and performance ratios that involve the average returns are<br />
based on the geometric average.<br />
22