Smart Beta 2.0 - EDHEC-Risk
Smart Beta 2.0 - EDHEC-Risk
Smart Beta 2.0 - EDHEC-Risk

Create successful ePaper yourself
Turn your PDF publications into a flip-book with our unique Google optimized e-Paper software.
1. The <strong>Risk</strong>s of <strong>Smart</strong> <strong>Beta</strong> Strategies<br />
basis of how much estimation risk they<br />
involve). On the other hand, the rhetoric<br />
from the promoters of fundamental or<br />
qualitative approaches linking this subject<br />
to the usage or otherwise of an optimiser<br />
does not seem to us to correspond to<br />
the reality of the risks. Indeed, any<br />
portfolio construction technique that uses<br />
parameters is confronted with the risk of<br />
estimating the parameters. The fact that<br />
these parameters are averaged accounting<br />
values as in the case of fundamental<br />
equity indexation strategies, which gives<br />
them less variability, does not in any<br />
way solve the problem of the out-ofsample<br />
robustness of the estimation of the<br />
parameters. On the contrary, the highly<br />
backward-looking aspect of parameter<br />
estimations based both on accounting<br />
values, and especially their average, often<br />
leads to parameter values that are highly<br />
sample-dependent. If we refer to the<br />
economic size of the banking sector, using<br />
an average of bank sizes between 2004<br />
and 2008 as a proxy for the economic<br />
size in 2009 does not necessarily give<br />
particularly relevant values. Ultimately,<br />
by denying the estimation risks of nonquantitative<br />
schemes, the promoters of<br />
ad-hoc approaches that are referred to<br />
as qualitative do not position themselves<br />
well to manage these risks properly or to<br />
allow investors to analyse them. Indeed,<br />
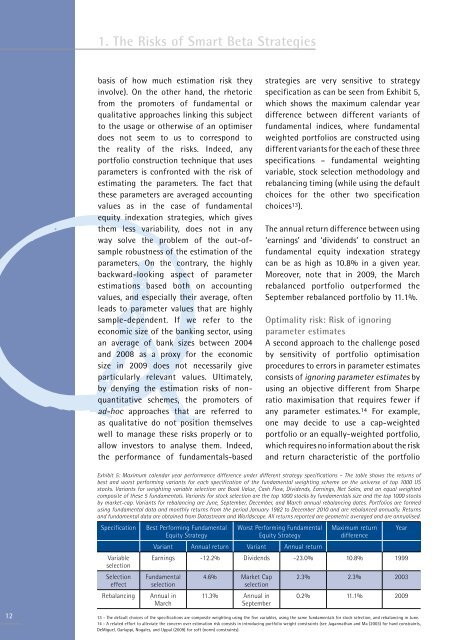
the performance of fundamentals-based<br />
strategies are very sensitive to strategy<br />
specification as can be seen from Exhibit 5,<br />
which shows the maximum calendar year<br />
difference between different variants of<br />
fundamental indices, where fundamental<br />
weighted portfolios are constructed using<br />
different variants for the each of these three<br />
specifications – fundamental weighting<br />
variable, stock selection methodology and<br />
rebalancing timing (while using the default<br />
choices for the other two specification<br />
choices 13 ).<br />
The annual return difference between using<br />
‘earnings’ and ‘dividends’ to construct an<br />
fundamental equity indexation strategy<br />
can be as high as 10.8% in a given year.<br />
Moreover, note that in 2009, the March<br />
rebalanced portfolio outperformed the<br />
September rebalanced portfolio by 11.1%.<br />
Optimality risk: <strong>Risk</strong> of ignoring<br />
parameter estimates<br />
A second approach to the challenge posed<br />
by sensitivity of portfolio optimisation<br />
procedures to errors in parameter estimates<br />
consists of ignoring parameter estimates by<br />
using an objective different from Sharpe<br />
ratio maximisation that requires fewer if<br />
any parameter estimates. 14 For example,<br />
one may decide to use a cap-weighted<br />
portfolio or an equally-weighted portfolio,<br />
which requires no information about the risk<br />
and return characteristic of the portfolio<br />
12<br />
Exhibit 5: Maximum calendar year performance difference under different strategy specifications – The table shows the returns of<br />
best and worst performing variants for each specification of the fundamental weighting scheme on the universe of top 1000 US<br />
stocks. Variants for weighting variable selection are Book Value, Cash Flow, Dividends, Earnings, Net Sales, and an equal weighted<br />
composite of these 5 fundamentals. Variants for stock selection are the top 1000 stocks by fundamentals size and the top 1000 stocks<br />
by market-cap. Variants for rebalancing are June, September, December, and March annual rebalancing dates. Portfolios are formed<br />
using fundamental data and monthly returns from the period January 1982 to December 2010 and are rebalanced annually. Returns<br />
and fundamental data are obtained from Datastream and Worldscope. All returns reported are geometric averaged and are annualised.<br />
Specification<br />
Variable<br />
selection<br />
Selection<br />
effect<br />
Rebalancing<br />
Best Performing Fundamental<br />
Equity Strategy<br />
Worst Performing Fundamental<br />
Equity Strategy<br />
Maximum return<br />
difference<br />
Variant Annual return Variant Annual return<br />
Earnings -12.2% Dividends -23.0% 10.8% 1999<br />
Fundamental<br />
selection<br />
Annual in<br />
March<br />
4.6% Market Cap<br />
selection<br />
11.3% Annual in<br />
September<br />
13 - The default choices of the specifications are composite weighting using the five variables, using the same fundamentals for stock selection, and rebalancing in June.<br />
14 - A related effort to alleviate the concern over estimation risk consists in introducing portfolio weight constraints (see Jagannathan and Ma (2003) for hard constraints,<br />
DeMiguel, Garlappi, Nogales, and Uppal (2009) for soft (norm) constraints).<br />
Year<br />
2.3% 2.3% 2003<br />
0.2% 11.1% 2009