Smart Beta 2.0 - EDHEC-Risk
Smart Beta 2.0 - EDHEC-Risk
Smart Beta 2.0 - EDHEC-Risk

You also want an ePaper? Increase the reach of your titles
YUMPU automatically turns print PDFs into web optimized ePapers that Google loves.
1. The <strong>Risk</strong>s of <strong>Smart</strong> <strong>Beta</strong> Strategies<br />
investor to be exposed to particular<br />
systematic risks which represent the very<br />
source of their performance.<br />
As such, since they deconcentrate capweighted<br />
indices that are traditionally<br />
exposed to momentum and large growth<br />
risk, the first-generation smart beta<br />
indices are often exposed to value, small<br />
or mid-cap, and sometimes contrarian,<br />
biases. Moreover, specific tilts on risk<br />
factors that are not particularly related to<br />
deconcentration but to the objectives of<br />
the scheme itself, can amplify these biases.<br />
For example, fundamentally weighted<br />
indices have a value bias due to their use<br />
of accounting measures which are related<br />
to the ratios applied in the construction<br />
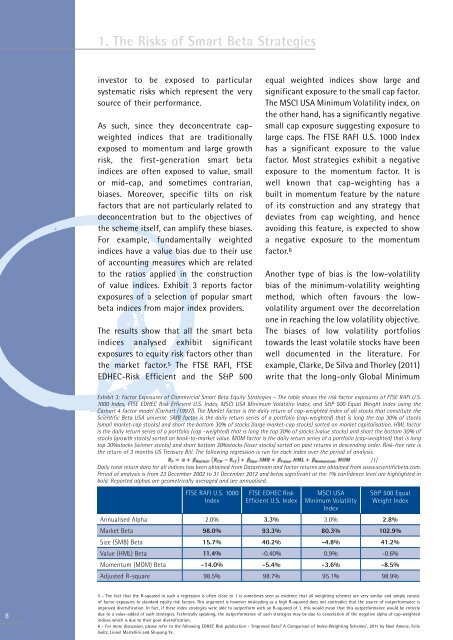
of value indices. Exhibit 3 reports factor<br />
exposures of a selection of popular smart<br />
beta indices from major index providers.<br />
The results show that all the smart beta<br />
indices analysed exhibit significant<br />
exposures to equity risk factors other than<br />
the market factor. 5 The FTSE RAFI, FTSE<br />
<strong>EDHEC</strong>-<strong>Risk</strong> Efficient and the S&P 500<br />
equal weighted indices show large and<br />
significant exposure to the small cap factor.<br />
The MSCI USA Minimum Volatility index, on<br />
the other hand, has a significantly negative<br />
small cap exposure suggesting exposure to<br />
large caps. The FTSE RAFI U.S. 1000 Index<br />
has a significant exposure to the value<br />
factor. Most strategies exhibit a negative<br />
exposure to the momentum factor. It is<br />
well known that cap-weighting has a<br />
built in momentum feature by the nature<br />
of its construction and any strategy that<br />
deviates from cap weighting, and hence<br />
avoiding this feature, is expected to show<br />
a negative exposure to the momentum<br />
factor. 6<br />
Another type of bias is the low-volatility<br />
bias of the minimum-volatility weighting<br />
method, which often favours the lowvolatility<br />
argument over the decorrelation<br />
one in reaching the low volatility objective.<br />
The biases of low volatility portfolios<br />
towards the least volatile stocks have been<br />
well documented in the literature. For<br />
example, Clarke, De Silva and Thorley (2011)<br />
write that the long-only Global Minimum<br />
Exhibit 3: Factor Exposures of Commercial <strong>Smart</strong> <strong>Beta</strong> Equity Strategies – The table shows the risk factor exposures of FTSE RAFI U.S.<br />
1000 Index, FTSE <strong>EDHEC</strong> <strong>Risk</strong> Efficient U.S. Index, MSCI USA Minimum Volatility Index, and S&P 500 Equal Weight Index using the<br />
Carhart 4 factor model (Carhart (1997)). The Market factor is the daily return of cap-weighted index of all stocks that constitute the<br />
Scientific <strong>Beta</strong> USA universe. SMB factor is the daily return series of a portfolio (cap-weighted) that is long the top 30% of stocks<br />
(small market-cap stocks) and short the bottom 30% of stocks (large market-cap stocks) sorted on market capitalisation. HML factor<br />
is the daily return series of a portfolio (cap -weighted) that is long the top 30% of stocks (value stocks) and short the bottom 30% of<br />
stocks (growth stocks) sorted on book-to-market value. MOM factor is the daily return series of a portfolio (cap-weighted) that is long<br />
top 30%stocks (winner stocks) and short bottom 30%stocks (loser stocks) sorted on past returns in descending order. <strong>Risk</strong>-free rate is<br />
the return of 3 months US Treasury Bill. The following regression is run for each index over the period of analysis.<br />
(1)<br />
Daily total return data for all indices has been obtained from Datastream and factor returns are obtained from www.scientificbeta.com.<br />
Period of analysis is from 23 December 2002 to 31 December 2012 and betas significant at the 1% confidence level are highlighted in<br />
bold. Reported alphas are geometrically averaged and are annualised.<br />
FTSE RAFI U.S. 1000<br />
Index<br />
FTSE <strong>EDHEC</strong> <strong>Risk</strong><br />
Efficient U.S. Index<br />
MSCI USA<br />
Minimum Volatility<br />
Index<br />
S&P 500 Equal<br />
Weight Index<br />
Annualised Alpha <strong>2.0</strong>% 3.3% 3.0% 2.8%<br />
Market <strong>Beta</strong> 98.0% 93.3% 80.3% 102.9%<br />
Size (SMB) <strong>Beta</strong> 15.7% 40.2% -4.8% 41.2%<br />
Value (HML) <strong>Beta</strong> 11.4% -0.40% 0.9% -0.6%<br />
Momentum (MOM) <strong>Beta</strong> -14.0% -5.4% -3.6% -8.5%<br />
Adjusted R-square 98.5% 98.7% 95.1% 98.9%<br />
8<br />
5 - The fact that the R-squared in such a regression is often close to 1 is sometimes seen as evidence that all weighting schemes are very similar and simply consist<br />
of factor exposures to standard equity risk factors. This argument is however misleading as a high R-squared does not contradict that the source of outperformance is<br />
improved diversification. In fact, if these index strategies were able to outperform with an R-squared of 1, this would mean that this outperformance would be entirely<br />
due to a value-added of such strategies. Technically speaking, the outperformance of such strategies may be due to cancelation of the negative alpha of cap-weighted<br />
indices which is due to their poor diversification.<br />
6 - For more discussion, please refer to the following <strong>EDHEC</strong> <strong>Risk</strong> publication - ‘Improved <strong>Beta</strong>? A Comparison of Index-Weighting Schemes’, 2011 by Noel Amenc, Felix<br />
Goltz, Lionel Martellini and Shuyang Ye.