Smart Beta 2.0 - EDHEC-Risk
Smart Beta 2.0 - EDHEC-Risk
Smart Beta 2.0 - EDHEC-Risk

You also want an ePaper? Increase the reach of your titles
YUMPU automatically turns print PDFs into web optimized ePapers that Google loves.
2. Controlling the <strong>Risk</strong>s of <strong>Smart</strong> <strong>Beta</strong> Investing:<br />
The <strong>Smart</strong> <strong>Beta</strong> <strong>2.0</strong> Approach<br />
significant pronounced small-cap exposure.<br />
Amenc, Goltz and Lodh (2012) show that<br />
qualitatively similar results hold when<br />
selecting stocks based on dividend yield or<br />
low and high volatility characteristics.<br />
For these different stock characteristics,<br />
it is possible to reduce or cancel implicit<br />
factor tilts of a weighting scheme through<br />
an appropriate stock selection decision.<br />
An additional question is whether<br />
improvements in risk/return properties of<br />
the weighting scheme relative to the broad<br />
cap-weighted index still hold after having<br />
corrected for the factor tilts. Exhibit 10<br />
below shows results from the article which<br />
addresses this question for the case of<br />
size-based selection.<br />
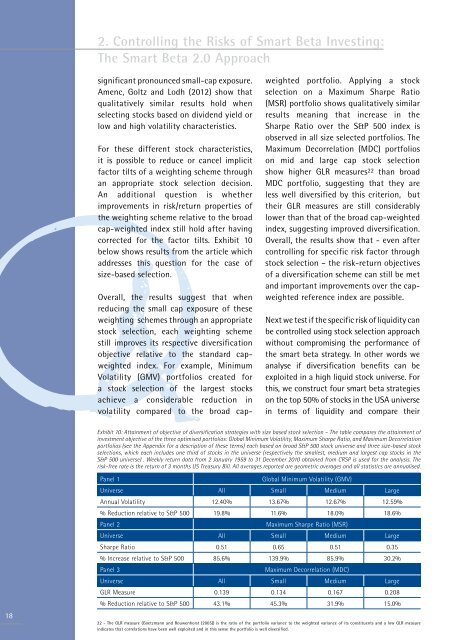
Overall, the results suggest that when<br />
reducing the small cap exposure of these<br />
weighting schemes through an appropriate<br />
stock selection, each weighting scheme<br />
still improves its respective diversification<br />
objective relative to the standard capweighted<br />
index. For example, Minimum<br />
Volatility (GMV) portfolios created for<br />
a stock selection of the largest stocks<br />
achieve a considerable reduction in<br />
volatility compared to the broad capweighted<br />
portfolio. Applying a stock<br />
selection on a Maximum Sharpe Ratio<br />
(MSR) portfolio shows qualitatively similar<br />
results meaning that increase in the<br />
Sharpe Ratio over the S&P 500 index is<br />
observed in all size selected portfolios. The<br />
Maximum Decorrelation (MDC) portfolios<br />
on mid and large cap stock selection<br />
show higher GLR measures 22 than broad<br />
MDC portfolio, suggesting that they are<br />
less well diversified by this criterion, but<br />
their GLR measures are still considerably<br />
lower than that of the broad cap-weighted<br />
index, suggesting improved diversification.<br />
Overall, the results show that - even after<br />
controlling for specific risk factor through<br />
stock selection – the risk-return objectives<br />
of a diversification scheme can still be met<br />
and important improvements over the capweighted<br />
reference index are possible.<br />
Next we test if the specific risk of liquidity can<br />
be controlled using stock selection approach<br />
without compromising the performance of<br />
the smart beta strategy. In other words we<br />
analyse if diversification benefits can be<br />
exploited in a high liquid stock universe. For<br />
this, we construct four smart beta strategies<br />
on the top 50% of stocks in the USA universe<br />
in terms of liquidity and compare their<br />
Exhibit 10: Attainment of objective of diversification strategies with size based stock selection – The table compares the attainment of<br />
investment objective of the three optimised portfolios: Global Minimum Volatility, Maximum Sharpe Ratio, and Maximum Decorrelation<br />
portfolios (see the Appendix for a description of these terms) each based on broad S&P 500 stock universe and three size-based stock<br />
selections, which each includes one third of stocks in the universe (respectively the smallest, medium and largest cap stocks in the<br />
S&P 500 universe) . Weekly return data from 2 January 1959 to 31 December 2010 obtained from CRSP is used for the analysis. The<br />
risk-free rate is the return of 3 months US Treasury Bill. All averages reported are geometric averages and all statistics are annualised.<br />
18<br />
Panel 1<br />
Global Minimum Volatility (GMV)<br />
Universe All Small Medium Large<br />
Annual Volatility 12.40% 13.67% 12.67% 12.59%<br />
% Reduction relative to S&P 500 19.8% 11.6% 18.0% 18.6%<br />
Panel 2<br />
Maximum Sharpe Ratio (MSR)<br />
Universe All Small Medium Large<br />
Sharpe Ratio 0.51 0.65 0.51 0.35<br />
% Increase relative to S&P 500 85.6% 139.9% 85.9% 30.2%<br />
Panel 3<br />
Maximum Decorrelation (MDC)<br />
Universe All Small Medium Large<br />
GLR Measure 0.139 0.134 0.167 0.208<br />
% Reduction relative to S&P 500 43.1% 45.3% 31.9% 15.0%<br />
22 - The GLR measure (Goetzmann and Rouwenhorst (2005)) is the ratio of the portfolio variance to the weighted variance of its constituents and a low GLR measure<br />
indicates that correlations have been well exploited and in this sense the portfolio is well diversified.