Smart Beta 2.0 - EDHEC-Risk
Smart Beta 2.0 - EDHEC-Risk
Smart Beta 2.0 - EDHEC-Risk

You also want an ePaper? Increase the reach of your titles
YUMPU automatically turns print PDFs into web optimized ePapers that Google loves.
2. Controlling the <strong>Risk</strong>s of <strong>Smart</strong> <strong>Beta</strong> Investing:<br />
The <strong>Smart</strong> <strong>Beta</strong> <strong>2.0</strong> Approach<br />
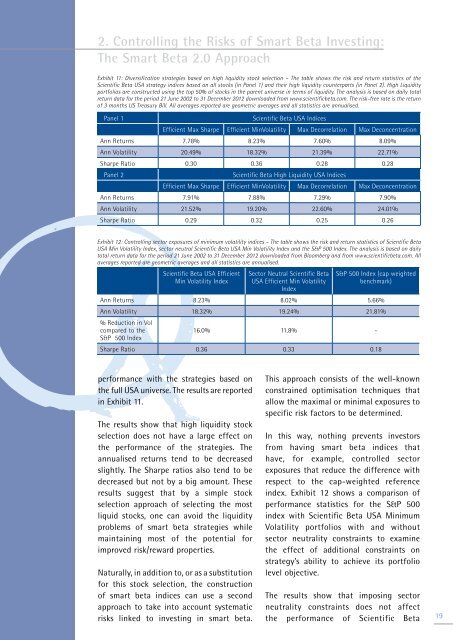
Exhibit 11: Diversification strategies based on high liquidity stock selection – The table shows the risk and return statistics of the<br />
Scientific <strong>Beta</strong> USA strategy indices based on all stocks (in Panel 1) and their high liquidity counterparts (in Panel 2). High Liquidity<br />
portfolios are constructed using the top 50% of stocks in the parent universe in terms of liquidity. The analysis is based on daily total<br />
return data for the period 21 June 2002 to 31 December 2012 downloaded from www.scientificbeta.com. The risk-free rate is the return<br />
of 3 months US Treasury Bill. All averages reported are geometric averages and all statistics are annualised.<br />
Panel 1<br />
Scientific <strong>Beta</strong> USA Indices<br />
Efficient Max Sharpe Efficient MinVolatility Max Decorrelation Max Deconcentration<br />
Ann Returns 7.78% 8.23% 7.60% 8.09%<br />
Ann Volatility 20.49% 18.32% 21.39% 22.71%<br />
Sharpe Ratio 0.30 0.36 0.28 0.28<br />
Panel 2<br />
Scientific <strong>Beta</strong> High Liquidity USA Indices<br />
Efficient Max Sharpe Efficient MinVolatility Max Decorrelation Max Deconcentration<br />
Ann Returns 7.91% 7.88% 7.29% 7.90%<br />
Ann Volatility 21.52% 19.20% 22.60% 24.01%<br />
Sharpe Ratio 0.29 0.32 0.25 0.26<br />
Exhibit 12: Controlling sector exposures of minimum volatility indices – The table shows the risk and return statistics of Scientific <strong>Beta</strong><br />
USA Min Volatility Index, sector neutral Scientific <strong>Beta</strong> USA Min Volatility Index and the S&P 500 Index. The analysis is based on daily<br />
total return data for the period 21 June 2002 to 31 December 2012 downloaded from Bloomberg and from www.scientificbeta.com. All<br />
averages reported are geometric averages and all statistics are annualised.<br />
Scientific <strong>Beta</strong> USA Efficient<br />
Min Volatility Index<br />
Sector Neutral Scientific <strong>Beta</strong><br />
USA Efficient Min Volatility<br />
Index<br />
S&P 500 Index (cap weighted<br />
benchmark)<br />
Ann Returns 8.23% 8.02% 5.66%<br />
Ann Volatility 18.32% 19.24% 21.81%<br />
% Reduction in Vol<br />
compared to the<br />
16.0% 11.8% -<br />
S&P 500 Index<br />
Sharpe Ratio 0.36 0.33 0.18<br />
performance with the strategies based on<br />
the full USA universe. The results are reported<br />
in Exhibit 11.<br />
The results show that high liquidity stock<br />
selection does not have a large effect on<br />
the performance of the strategies. The<br />
annualised returns tend to be decreased<br />
slightly. The Sharpe ratios also tend to be<br />
decreased but not by a big amount. These<br />
results suggest that by a simple stock<br />
selection approach of selecting the most<br />
liquid stocks, one can avoid the liquidity<br />
problems of smart beta strategies while<br />
maintaining most of the potential for<br />
improved risk/reward properties.<br />
Naturally, in addition to, or as a substitution<br />
for this stock selection, the construction<br />
of smart beta indices can use a second<br />
approach to take into account systematic<br />
risks linked to investing in smart beta.<br />
This approach consists of the well-known<br />
constrained optimisation techniques that<br />
allow the maximal or minimal exposures to<br />
specific risk factors to be determined.<br />
In this way, nothing prevents investors<br />
from having smart beta indices that<br />
have, for example, controlled sector<br />
exposures that reduce the difference with<br />
respect to the cap-weighted reference<br />
index. Exhibit 12 shows a comparison of<br />
performance statistics for the S&P 500<br />
index with Scientific <strong>Beta</strong> USA Minimum<br />
Volatility portfolios with and without<br />
sector neutrality constraints to examine<br />
the effect of additional constraints on<br />
strategy’s ability to achieve its portfolio<br />
level objective.<br />
The results show that imposing sector<br />
neutrality constraints does not affect<br />
the performance of Scientific <strong>Beta</strong> 19