Smart Beta 2.0 - EDHEC-Risk
Smart Beta 2.0 - EDHEC-Risk
Smart Beta 2.0 - EDHEC-Risk

Create successful ePaper yourself
Turn your PDF publications into a flip-book with our unique Google optimized e-Paper software.
1. The <strong>Risk</strong>s of <strong>Smart</strong> <strong>Beta</strong> Strategies<br />
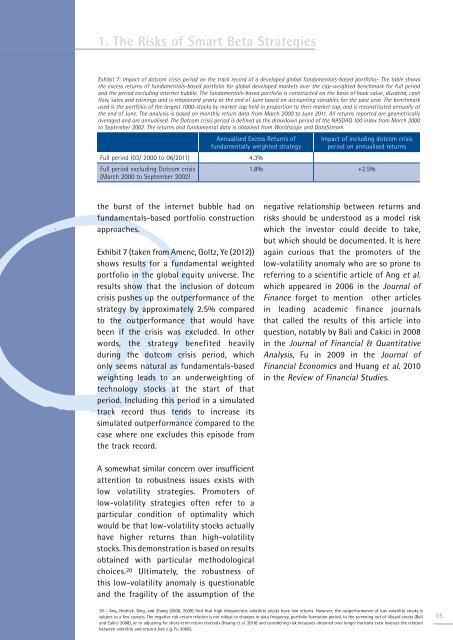
Exhibit 7: Impact of dotcom crisis period on the track record of a developed global fundamentals-based portfolio– The table shows<br />
the excess returns of fundamentals-based portfolio for global developed markets over the cap-weighted benchmark for full period<br />
and the period excluding internet bubble. The fundamentals-based portfolio is constructed on the basis of book value, dividend, cash<br />
flow, sales and earnings and is rebalanced yearly at the end of June based on accounting variables for the past year. The benchmark<br />
used is the portfolio of the largest 1000-stocks by market cap held in proportion to their market cap, and is reconstituted annually at<br />
the end of June. The analysis is based on monthly return data from March 2000 to June 2011. All returns reported are geometrically<br />
averaged and are annualised. The Dotcom crisis period is defined as the drawdown period of the NASDAQ 100 index from March 2000<br />
to September 2002. The returns and fundamental data is obtained from Worldscope and DataStream.<br />
Annualised Excess Returns of<br />
fundamentally weighted strategy<br />
Full period (03/ 2000 to 06/2011) 4.3%<br />
Full period excluding Dotcom crisis<br />
(March 2000 to September 2002)<br />
Impact of including dotcom crisis<br />
period on annualised returns<br />
1.8% +2.5%<br />
the burst of the internet bubble had on<br />
fundamentals-based portfolio construction<br />
approaches.<br />
Exhibit 7 (taken from Amenc, Goltz, Ye (2012))<br />
shows results for a fundamental weighted<br />
portfolio in the global equity universe. The<br />
results show that the inclusion of dotcom<br />
crisis pushes up the outperformance of the<br />
strategy by approximately 2.5% compared<br />
to the outperformance that would have<br />
been if the crisis was excluded. In other<br />
words, the strategy benefited heavily<br />
during the dotcom crisis period, which<br />
only seems natural as fundamentals-based<br />
weighting leads to an underweighting of<br />
technology stocks at the start of that<br />
period. Including this period in a simulated<br />
track record thus tends to increase its<br />
simulated outperformance compared to the<br />
case where one excludes this episode from<br />
the track record.<br />
negative relationship between returns and<br />
risks should be understood as a model risk<br />
which the investor could decide to take,<br />
but which should be documented. It is here<br />
again curious that the promoters of the<br />
low-volatility anomaly who are so prone to<br />
referring to a scientific article of Ang et al.<br />
which appeared in 2006 in the Journal of<br />
Finance forget to mention other articles<br />
in leading academic finance journals<br />
that called the results of this article into<br />
question, notably by Bali and Cakici in 2008<br />
in the Journal of Financial & Quantitative<br />
Analysis, Fu in 2009 in the Journal of<br />
Financial Economics and Huang et al. 2010<br />
in the Review of Financial Studies.<br />
A somewhat similar concern over insufficient<br />
attention to robustness issues exists with<br />
low volatility strategies. Promoters of<br />
low-volatility strategies often refer to a<br />
particular condition of optimality which<br />
would be that low-volatility stocks actually<br />
have higher returns than high-volatility<br />
stocks. This demonstration is based on results<br />
obtained with particular methodological<br />
choices. 20 Ultimately, the robustness of<br />
this low-volatility anomaly is questionable<br />
and the fragility of the assumption of the<br />
20 - Ang, Hodrick, Xing, and Zhang (2006, 2009) find that high idiosyncratic volatility stocks have low returns. However, the outperformance of low volatility stocks is<br />
subject to a few caveats. The negative risk-return relation is not robust to changes in data frequency, portfolio formation period, to the screening out of illiquid stocks (Bali<br />
and Cakici 2008), or to adjusting for short-term return reversals (Huang et al. 2010) and considering risk measures obtained over longer horizons even inverses the relation<br />
between volatility and returns (see e.g. Fu 2009).<br />
15