Smart Beta 2.0 - EDHEC-Risk
Smart Beta 2.0 - EDHEC-Risk
Smart Beta 2.0 - EDHEC-Risk

Create successful ePaper yourself
Turn your PDF publications into a flip-book with our unique Google optimized e-Paper software.
2. Controlling the <strong>Risk</strong>s of <strong>Smart</strong> <strong>Beta</strong> Investing:<br />
The <strong>Smart</strong> <strong>Beta</strong> <strong>2.0</strong> Approach<br />
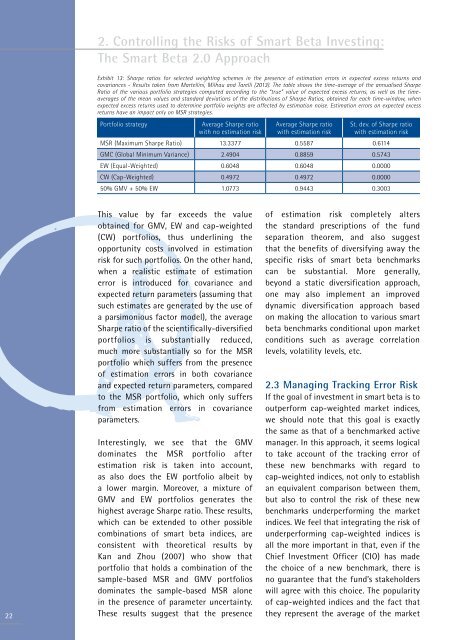
Exhibit 13: Sharpe ratios for selected weighting schemes in the presence of estimation errors in expected excess returns and<br />
covariances - Results taken from Martellini, Milhau and Tarelli (2013). The table shows the time-average of the annualised Sharpe<br />
Ratio of the various portfolio strategies computed according to the “true” value of expected excess returns, as well as the timeaverages<br />
of the mean values and standard deviations of the distributions of Sharpe Ratios, obtained for each time-window, when<br />
expected excess returns used to determine portfolio weights are affected by estimation noise. Estimation errors on expected excess<br />
returns have an impact only on MSR strategies.<br />
Portfolio strategy<br />
Average Sharpe ratio<br />
with no estimation risk<br />
Average Sharpe ratio<br />
with estimation risk<br />
St. dev. of Sharpe ratio<br />
with estimation risk<br />
MSR (Maximum Sharpe Ratio) 13.3377 0.5587 0.6114<br />
GMC (Global Minimum Variance) 2.4904 0.8859 0.5743<br />
EW (Equal-Weighted) 0.6048 0.6048 0.0000<br />
CW (Cap-Weighted) 0.4972 0.4972 0.0000<br />
50% GMV + 50% EW 1.0773 0.9443 0.3003<br />
22<br />
This value by far exceeds the value<br />
obtained for GMV, EW and cap-weighted<br />
(CW) portfolios, thus underlining the<br />
opportunity costs involved in estimation<br />
risk for such portfolios. On the other hand,<br />
when a realistic estimate of estimation<br />
error is introduced for covariance and<br />
expected return parameters (assuming that<br />
such estimates are generated by the use of<br />
a parsimonious factor model), the average<br />
Sharpe ratio of the scientifically-diversified<br />
portfolios is substantially reduced,<br />
much more substantially so for the MSR<br />
portfolio which suffers from the presence<br />
of estimation errors in both covariance<br />
and expected return parameters, compared<br />
to the MSR portfolio, which only suffers<br />
from estimation errors in covariance<br />
parameters.<br />
Interestingly, we see that the GMV<br />
dominates the MSR portfolio after<br />
estimation risk is taken into account,<br />
as also does the EW portfolio albeit by<br />
a lower margin. Moreover, a mixture of<br />
GMV and EW portfolios generates the<br />
highest average Sharpe ratio. These results,<br />
which can be extended to other possible<br />
combinations of smart beta indices, are<br />
consistent with theoretical results by<br />
Kan and Zhou (2007) who show that<br />
portfolio that holds a combination of the<br />
sample-based MSR and GMV portfolios<br />
dominates the sample-based MSR alone<br />
in the presence of parameter uncertainty.<br />
These results suggest that the presence<br />
of estimation risk completely alters<br />
the standard prescriptions of the fund<br />
separation theorem, and also suggest<br />
that the benefits of diversifying away the<br />
specific risks of smart beta benchmarks<br />
can be substantial. More generally,<br />
beyond a static diversification approach,<br />
one may also implement an improved<br />
dynamic diversification approach based<br />
on making the allocation to various smart<br />
beta benchmarks conditional upon market<br />
conditions such as average correlation<br />
levels, volatility levels, etc.<br />
2.3 Managing Tracking Error <strong>Risk</strong><br />
If the goal of investment in smart beta is to<br />
outperform cap-weighted market indices,<br />
we should note that this goal is exactly<br />
the same as that of a benchmarked active<br />
manager. In this approach, it seems logical<br />
to take account of the tracking error of<br />
these new benchmarks with regard to<br />
cap-weighted indices, not only to establish<br />
an equivalent comparison between them,<br />
but also to control the risk of these new<br />
benchmarks underperforming the market<br />
indices. We feel that integrating the risk of<br />
underperforming cap-weighted indices is<br />
all the more important in that, even if the<br />
Chief Investment Officer (CIO) has made<br />
the choice of a new benchmark, there is<br />
no guarantee that the fund’s stakeholders<br />
will agree with this choice. The popularity<br />
of cap-weighted indices and the fact that<br />
they represent the average of the market