Smart Beta 2.0 - EDHEC-Risk
Smart Beta 2.0 - EDHEC-Risk
Smart Beta 2.0 - EDHEC-Risk

You also want an ePaper? Increase the reach of your titles
YUMPU automatically turns print PDFs into web optimized ePapers that Google loves.
1. The <strong>Risk</strong>s of <strong>Smart</strong> <strong>Beta</strong> Strategies<br />
Variance (GMV) “portfolio averages about<br />
120 long securities, i.e., about 12% of<br />
the 1000-security investable set”. Likewise,<br />
DeMiguel, Garlappi, Nogales and Uppal<br />
(2009) argue that “Short sale-constrained<br />
minimum-variance portfolios […] tend to<br />
assign a weight different from zero to only<br />
a few of the assets”. This concentration<br />
leads to biases towards low risk (beta)<br />
stocks and utility stocks (Chan, Karceski and<br />
Lakonishok (1999)).<br />
These style biases, and more globally these<br />
risk factors, had been ignored in the<br />
promotion of the performance of firstgeneration<br />
smart beta indices. The foundation<br />
paper on fundamental indexation (Arnott,<br />
Hsu and Moore (2005)), which highlights<br />
the outperformance of this new form of<br />
beta in comparison with cap-weighted<br />
indices, does not contain any measure of<br />
the exposure of fundamentally-weighted<br />
indices to different style factors. The first<br />
documentation on these risk factors, and<br />
notably the value bias that explains a large<br />
part of the outperformance of fundamental<br />
indices was produced by others than the<br />
promoters of these indices and was only<br />
published in 2007/2008. 7 This has then led<br />
the promoters of fundamental indexation<br />
to justify the outperformance with new<br />
arguments that were not raised in the<br />
original 2005 article. 8 Likewise, promoters<br />
of equal-weighted indices have documented<br />
outperformance without correcting<br />
performance for risk factor exposures such<br />
as small cap and liquidity risk 9 and promoters<br />
of equal risk contribution (ERC) strategies,<br />
while pointing out that fundamental equity<br />
indexation suffers from value exposure, did<br />
not report any results on value and small<br />
cap exposures of the ERC strategy in their<br />
foundation paper (Demey, Maillard and<br />
Roncalli (2010)).<br />
We can also note that certain weighting<br />
schemes that are supposed to, for example,<br />
provide well-diversified proxies for efficient<br />
frontier portfolios can lead to considerable<br />
concentration in a small number of stocks<br />
and/or exhibit very pronounced sector or<br />
style biases.<br />
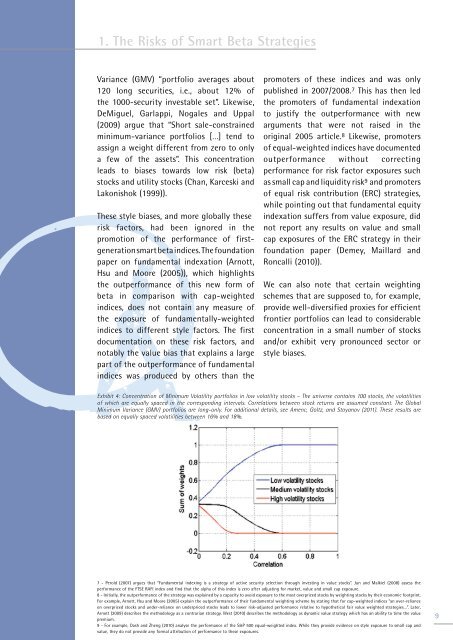
Exhibit 4: Concentration of Minimum Volatility portfolios in low volatility stocks – The universe contains 100 stocks, the volatilities<br />
of which are equally spaced in the corresponding intervals. Correlations between stock returns are assumed constant. The Global<br />
Minimum Variance (GMV) portfolios are long-only. For additional details, see Amenc, Goltz, and Stoyanov (2011). These results are<br />
based on equally spaced volatilities between 16% and 18%.<br />
7 - Perold (2007) argues that “Fundamental indexing is a strategy of active security selection through investing in value stocks”. Jun and Malkiel (2008) assess the<br />
performance of the FTSE RAFI index and find that the alpha of this index is zero after adjusting for market, value and small cap exposure.<br />
8 - Initially, the outperformance of the strategy was explained by a capacity to avoid exposure to the most overpriced stocks by weighting stocks by their economic footprint.<br />
For example, Arnott, Hsu and Moore (2005) explain the outperformance of their fundamental weighting scheme by stating that for cap-weighted indices “an over-reliance<br />
on overpriced stocks and under-reliance on underpriced stocks leads to lower risk-adjusted performance relative to hypothetical fair value weighted strategies…”. Later,<br />
Arnott (2009) describes the methodology as a contrarian strategy. West (2010) describes the methodology as dynamic value strategy which has an ability to time the value<br />
premium.<br />
9 - For example, Dash and Zheng (2010) analyse the performance of the S&P 500 equal-weighted index. While they provide evidence on style exposure to small cap and<br />
value, they do not provide any formal attribution of performance to these exposures.<br />
9