FINANCIAL SECTION - School District U-46
FINANCIAL SECTION - School District U-46
FINANCIAL SECTION - School District U-46

Create successful ePaper yourself
Turn your PDF publications into a flip-book with our unique Google optimized e-Paper software.
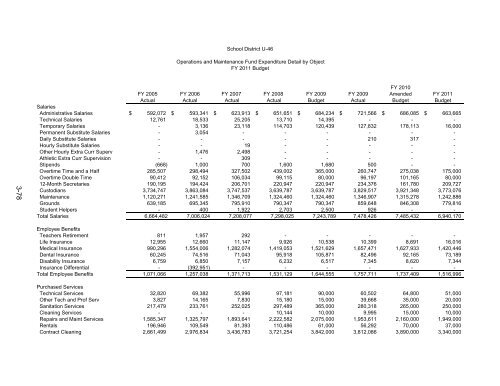
<strong>School</strong> <strong>District</strong> U-<strong>46</strong><br />
Operations and Maintenance Fund Expenditure Detail by Object<br />
FY 2011 Budget<br />
3-78<br />
FY 2010<br />
FY 2005 FY 2006 FY 2007 FY 2008 FY 2009 FY 2009 Amended FY 2011<br />
Actual Actual Actual Actual Budget Actual Budget Budget<br />
Salaries<br />
Administrative Salaries $ 592,072 $ 593,341 $ 623,913 $ 651,651 $ 684,234 $ 721,566 $ 686,085 $ 663,665<br />
Technical Salaries 12,761 18,533 25,205 13,710 14,395 - - -<br />
Temporary Salaries - 3,136 23,118 114,703 120,439 127,832 178,113 16,000<br />
Permanent Substitute Salaries - 3,054 - - - - - -<br />
Daily Substitute Salaries - - - - - 210 317 -<br />
Hourly Substitute Salaries - - 19 - - - - -<br />
Other Hourly Extra Curr Superv - 1,476 2,498 - - - - -<br />
Athletic Extra Curr Supervision - - 309 - - - - -<br />
Stipends (668) 1,000 700 1,600 1,680 500 - -<br />
Overtime Time and a Half 285,507 298,494 327,502 439,002 365,000 260,747 275,038 175,000<br />
Overtime Double Time 90,412 92,152 106,034 99,115 80,000 96,197 101,165 80,000<br />
12-Month Secretaries 190,195 194,424 206,701 220,947 220,947 234,376 161,780 209,727<br />
Custodians 3,734,747 3,863,084 3,747,537 3,639,787 3,639,787 3,829,517 3,921,348 3,773,076<br />
Maintenance 1,120,271 1,241,585 1,3<strong>46</strong>,709 1,324,<strong>46</strong>0 1,324,<strong>46</strong>0 1,3<strong>46</strong>,907 1,315,278 1,242,886<br />
Grounds 639,185 695,345 795,910 790,347 790,347 859,648 8<strong>46</strong>,308 779,816<br />
Student Helpers - 400 1,922 2,703 2,500 926 - -<br />
Total Salaries 6,664,482 7,006,024 7,208,077 7,298,025 7,243,789 7,478,426 7,485,432 6,940,170<br />
Employee Benefits<br />
Teachers Retirement 811 1,957 292 - - - - -<br />
Life Insurance 12,955 12,660 11,147 9,926 10,538 10,399 8,691 16,016<br />
Medical Insurance 990,296 1,554,006 1,282,074 1,419,053 1,521,629 1,657,471 1,627,933 1,420,4<strong>46</strong><br />
Dental Insurance 60,245 74,516 71,043 95,918 105,871 82,496 92,165 73,189<br />
Disability Insurance 6,759 6,850 7,157 6,232 6,517 7,345 8,620 7,344<br />
Insurance Differential - (392,951) - - - - - -<br />
Total Employee Benefits 1,071,066 1,257,038 1,371,713 1,531,129 1,644,555 1,757,711 1,737,409 1,516,996<br />
Purchased Services<br />
Technical Services 32,820 69,382 55,996 97,181 90,000 60,502 64,800 51,000<br />
Other Tech and Prof Serv 3,827 14,165 7,830 15,180 15,000 39,668 35,000 20,000<br />
Sanitation Services 217,479 233,761 252,025 297,489 365,000 280,318 265,000 250,000<br />
Cleaning Services - - - 10,144 10,000 9,995 15,000 10,000<br />
Repairs and Maint Services 1,585,347 1,325,797 1,893,641 2,222,582 2,075,000 1,953,611 2,160,000 1,949,000<br />
Rentals 196,9<strong>46</strong> 109,549 81,393 110,486 61,000 56,292 70,000 37,000<br />
Contract Cleaning 2,661,499 2,976,834 3,436,783 3,721,254 3,842,000 3,812,086 3,890,000 3,340,000