FINANCIAL SECTION - School District U-46
FINANCIAL SECTION - School District U-46
FINANCIAL SECTION - School District U-46

You also want an ePaper? Increase the reach of your titles
YUMPU automatically turns print PDFs into web optimized ePapers that Google loves.
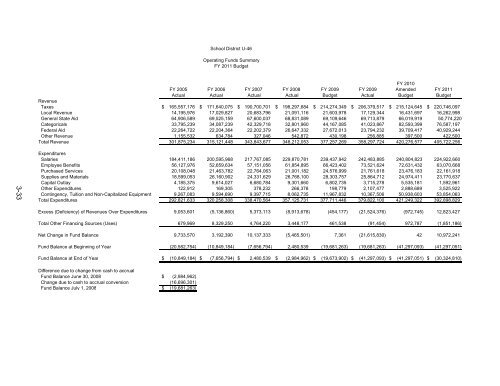
<strong>School</strong> <strong>District</strong> U-<strong>46</strong><br />
Operating Funds Summary<br />
FY 2011 Budget<br />
FY 2010<br />
FY 2005 FY 2006 FY 2007 FY 2008 FY 2009 FY 2009 Amended FY 2011<br />
Actual Actual Actual Actual Budget Actual Budget Budget<br />
Revenue<br />
Taxes $ 165,557,176 $ 171,640,075 $ 190,700,701 $ 198,297,684 $ 214,274,349 $ 206,379,517 $ 215,124,645 $ 220,7<strong>46</strong>,097<br />
Local Revenue 14,195,976 17,029,827 20,683,796 21,091,116 21,603,978 17,129,344 16,431,697 16,262,998<br />
General State Aid 64,906,589 69,525,159 67,600,037 68,831,089 69,109,6<strong>46</strong> 69,713,879 66,019,919 50,774,220<br />
Categoricals 33,795,239 34,087,239 42,329,718 32,801,960 44,167,085 41,023,867 82,593,399 76,587,197<br />
Federal Aid 22,264,722 22,204,364 22,202,379 26,647,332 27,672,013 23,794,232 39,709,417 40,929,244<br />
Other Revenue 1,155,532 634,784 327,0<strong>46</strong> 542,872 430,198 256,885 397,500 422,500<br />
Total Revenue 301,875,234 315,121,448 343,843,677 348,212,053 377,257,269 358,297,724 420,276,577 405,722,256<br />
3-33<br />
Expenditures<br />
Salaries 184,411,186 200,595,968 217,767,085 229,870,781 239,437,942 242,483,885 240,804,823 224,922,660<br />
Employee Benefits 56,127,976 52,659,634 57,151,056 61,854,895 66,423,402 73,521,624 72,631,432 63,070,668<br />
Purchased Services 20,108,048 21,<strong>46</strong>3,782 22,764,063 21,001,182 24,576,999 21,761,618 23,476,183 22,161,918<br />
Supplies and Materials 18,599,053 26,160,902 24,331,629 26,768,100 28,303,757 25,864,712 24,974,411 23,770,637<br />
Capital Outlay 4,185,375 9,614,027 6,680,784 9,301,660 6,802,735 3,715,278 5,535,181 1,592,961<br />
Other Expenditures 122,912 169,305 378,232 266,378 198,779 2,107,477 2,888,689 3,525,922<br />
Contingency, Tuition and Non-Capitalized Equipment 9,267,083 9,594,690 9,397,715 8,062,735 11,967,832 10,367,506 50,938,603 53,854,063<br />
Total Expenditures 292,821,633 320,258,308 338,470,564 357,125,731 377,711,4<strong>46</strong> 379,822,100 421,249,322 392,898,829<br />
Excess (Deficiency) of Revenues Over Expenditures 9,053,601 (5,136,860) 5,373,113 (8,913,678) (454,177) (21,524,376) (972,745) 12,823,427<br />
Total Other Financing Sources (Uses) 679,969 8,329,250 4,764,220 3,448,177 <strong>46</strong>1,538 (91,454) 972,787 (1,851,186)<br />
Net Change in Fund Balance 9,733,570 3,192,390 10,137,333 (5,<strong>46</strong>5,501) 7,361 (21,615,830) 42 10,972,241<br />
Fund Balance at Beginning of Year (20,582,754) (10,849,184) (7,656,794) 2,480,539 (19,681,263) (19,681,263) (41,297,093) (41,297,051)<br />
Fund Balance at End of Year $ (10,849,184) $ (7,656,794) $ 2,480,539 $ (2,984,962) $ (19,673,902) $ (41,297,093) $ (41,297,051) $ (30,324,810)<br />
Difference due to change from cash to accrual<br />
Fund Balance June 30, 2008 $ (2,984,962)<br />
Change due to cash to accrual conversion (16,696,301)<br />
Fund Balance July 1, 2008 $ (19,681,263)