PhD Thesis, 2007 - University College Cork
PhD Thesis, 2007 - University College Cork
PhD Thesis, 2007 - University College Cork

Create successful ePaper yourself
Turn your PDF publications into a flip-book with our unique Google optimized e-Paper software.
Chapter 6<br />
Water and energy budgets<br />
6.5.2 Dormant season (October to March)<br />
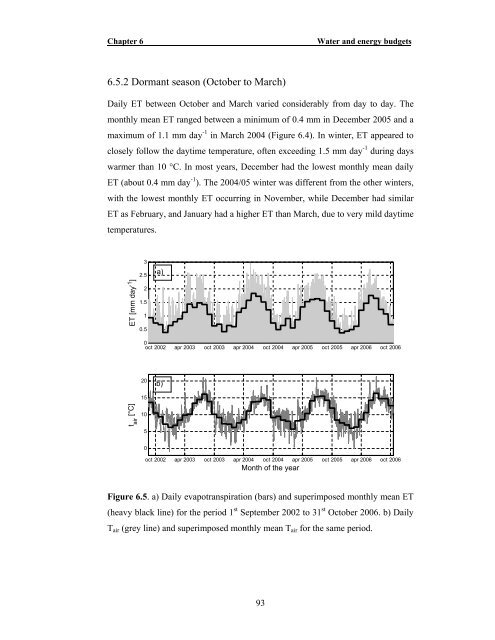
Daily ET between October and March varied considerably from day to day. The<br />
monthly mean ET ranged between a minimum of 0.4 mm in December 2005 and a<br />
maximum of 1.1 mm day -1 in March 2004 (Figure 6.4). In winter, ET appeared to<br />
closely follow the daytime temperature, often exceeding 1.5 mm day -1 during days<br />
warmer than 10 °C. In most years, December had the lowest monthly mean daily<br />
ET (about 0.4 mm day -1 ). The 2004/05 winter was different from the other winters,<br />
with the lowest monthly ET occurring in November, while December had similar<br />
ET as February, and January had a higher ET than March, due to very mild daytime<br />
temperatures.<br />
ET [mm day -1 ]<br />
3<br />
2.5<br />
2<br />
1.5<br />
1<br />
0.5<br />
a)<br />
0<br />
oct 2002 apr 2003 oct 2003 apr 2004 oct 2004 apr 2005 oct 2005 apr 2006 oct 2006<br />
20<br />
b)<br />
15<br />
t air<br />
[°C]<br />
10<br />
5<br />
0<br />
oct 2002 apr 2003 oct 2003 apr 2004 oct 2004 apr 2005 oct 2005 apr 2006 oct 2006<br />
Month of the year<br />
Figure 6.5. a) Daily evapotranspiration (bars) and superimposed monthly mean ET<br />
(heavy black line) for the period 1 st September 2002 to 31 st October 2006. b) Daily<br />
T air (grey line) and superimposed monthly mean T air for the same period.<br />
93