PhD Thesis, 2007 - University College Cork
PhD Thesis, 2007 - University College Cork
PhD Thesis, 2007 - University College Cork
You also want an ePaper? Increase the reach of your titles
YUMPU automatically turns print PDFs into web optimized ePapers that Google loves.
Chapter 3<br />
Materials and Methods<br />
3.4 The Eddy Covariance methodology<br />
3.4.1 Eddy Covariance technique<br />
A flux is the transfer of a quantity per unit area per unit time. An eddy flux is a<br />
transfer of a quantity by the turbulent motion of air. Eddy covariance is a<br />
micrometeorological technique that measures the turbulent flux across the<br />
vegetation canopy-atmosphere layer to determine the net difference of material<br />
moving across this interface (Lenschow, 1995; Baldocchi, 2003). Two fast<br />
response instruments are necessary for EC measurements: a 3-D sonic anemometer<br />
and an infrared gas analyser, both operating at high frequency (generally at 10 Hz),<br />
to cover the full range of the turbulent motion.<br />
In the Glencar Atlantic blanket bog, we used an open-path infrared gas analyser<br />
(Chapter 5 and 6, Appendix 1 and 2). Compared to close-path sensors, the openpath<br />
gas analyser has easier computational requirements and causes less<br />
aerodynamic disturbance, due to its open structure (Baldocchi, 2003). The main<br />
disadvantage of an open-path sensor is its poor performance during rainy<br />
conditions. The flux data were logged on a CR23X data logger (Campbell<br />
Scientific, UK). Since this data logger does not have a very powerful memory, the<br />
10 Hz data were averaged online over a 30-minute period based on a running-mean<br />
approach (Aubinet et al., 2000) and 10 Hz data were then discarded, reducing the<br />
possibility for further analysis of 10 Hz measured data.<br />
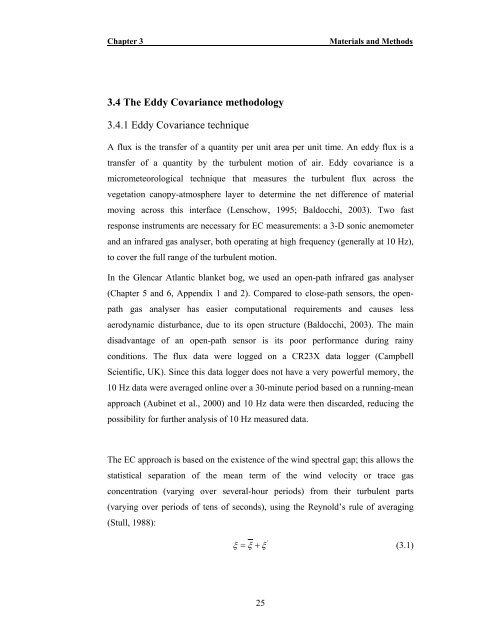
The EC approach is based on the existence of the wind spectral gap; this allows the<br />
statistical separation of the mean term of the wind velocity or trace gas<br />
concentration (varying over several-hour periods) from their turbulent parts<br />
(varying over periods of tens of seconds), using the Reynold’s rule of averaging<br />
(Stull, 1988):<br />
ξ +<br />
'<br />
= ξ ξ<br />
(3.1)<br />
25


