PhD Thesis, 2007 - University College Cork
PhD Thesis, 2007 - University College Cork
PhD Thesis, 2007 - University College Cork

Create successful ePaper yourself
Turn your PDF publications into a flip-book with our unique Google optimized e-Paper software.
Chapter 6<br />
Water and energy budgets<br />
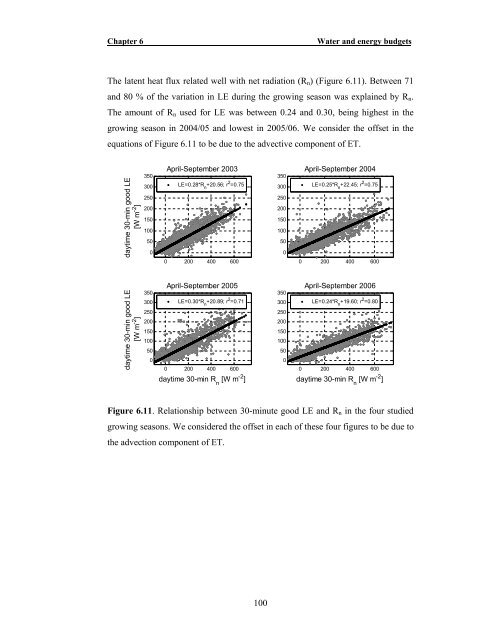
The latent heat flux related well with net radiation (R n ) (Figure 6.11). Between 71<br />
and 80 % of the variation in LE during the growing season was explained by R n .<br />
The amount of R n used for LE was between 0.24 and 0.30, being highest in the<br />
growing season in 2004/05 and lowest in 2005/06. We consider the offset in the<br />
equations of Figure 6.11 to be due to the advective component of ET.<br />
daytime 30-min good LE<br />
[W m -2 ]<br />
350<br />
300<br />
250<br />
200<br />
150<br />
100<br />
50<br />
0<br />
April-September 2003<br />
LE=0.28*R n<br />
+20.56; r 2 =0.75 300 LE=0.25*R n<br />
+22.45; r 2 =0.75<br />
250<br />
200<br />
150<br />
100<br />
50<br />
0<br />
0 200 400 600<br />
0 200 400 600<br />
350<br />
April-September 2004<br />
daytime 30-min good LE<br />
[W m -2 ]<br />
350<br />
300<br />
250<br />
200<br />
150<br />
100<br />
50<br />
0<br />
April-September 2005<br />
LE=0.30*R n<br />
+20.89; r 2 =0.71 300 LE=0.24*R n<br />
+19.60; r 2 =0.80<br />
250<br />
200<br />
150<br />
100<br />
50<br />
0<br />
0 200 400 600<br />
0 200 400 600<br />
daytime 30-min R n<br />
[W m -2 ]<br />
daytime 30-min R n<br />
[W m -2 ]<br />
350<br />
April-September 2006<br />
Figure 6.11. Relationship between 30-minute good LE and R n in the four studied<br />
growing seasons. We considered the offset in each of these four figures to be due to<br />
the advection component of ET.<br />
100